
Fig. 2.
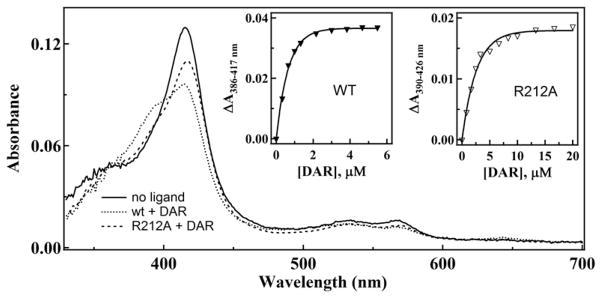
Spectra of ligand-free and DAR-bound WT and R212A CYP3A4. Absorbance spectra of 1.2 μM CYP3A4 were recorded in the absence and presence of 6 μM DAR. Insets a and b, plots of absorbance changes observed during equilibrium titrations of WT and R212A CYP3A4, respectively, vs. DAR concentration. Ks values derived from the plots are given in Table 2.