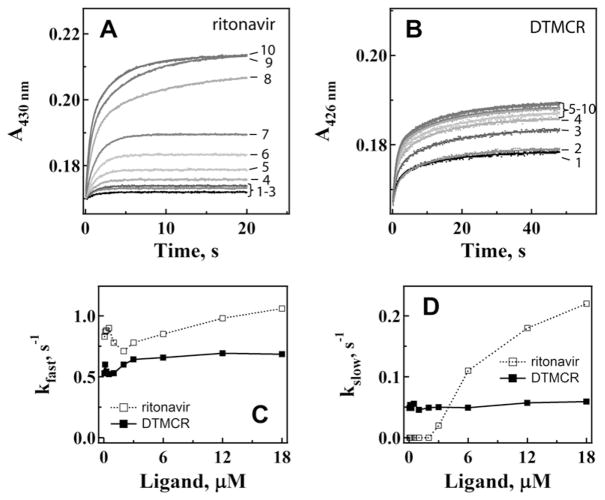
Fig. 6.
Kinetics of ritonavir (A) and DTMCR (B) binding to CYP3A4 R212A. Ligation of 0.067, 0.125, 0.25, 0.5, 1, 2, 4, 6, 12 and 18 μM inhibitors (traces 1–10, respectively) to 3 μM CYP3A4 was monitored in a stopped flow spectrophotometer at 426 nm. The observed rate constants were calculated from mono- or biexponential fits (solid lines) to kinetic traces and plotted vs. ligand concentration (panels C and D). The kfast and kslow values calculated at maximal ligand concentrations are shown in Table 2.

