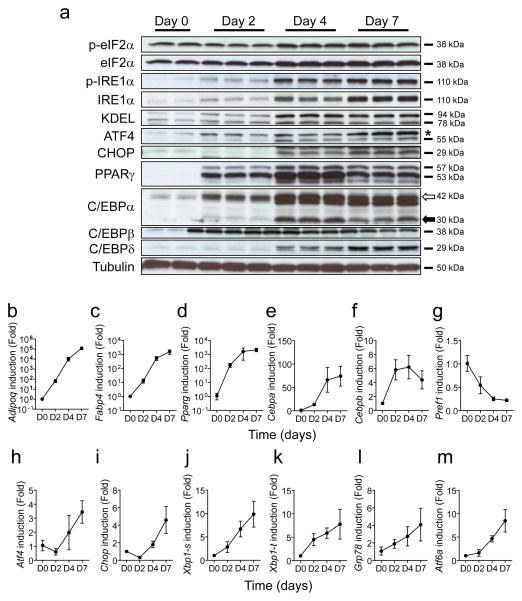
Fig. 1.
Expression of ER stress genes is upregulated during adipogenesis in 3T3-L1 cells. (a) Protein expression profiles for adipocyte-related genes and UPR-related genes. Cell lysates were collected at the indicated times after the start of adipocyte differentiation and analysed by western blotting analysis. The white and black arrows indicate larger and smaller isoforms of C/EBPα (* indicates a non-specific band). p-eIF2α and p-IRE1α indicate phosphorylated forms of eIF2α and IRE1α, respectively. KDEL antibody can detect GRP78 and GRP94 proteins (b–m) Gene expression profiles for adipocyte-related and UPR-related genes. Total RNA was isolated from 3T3-L1 cells at the indicated times during adipogenesis and mRNA levels were measured by quantitative real-time RT-PCR. Xbp1-s and Xbp1-t indicate spliced and total Xbp1, respectively. D0, D2, D4 and D7 indicate day 0, day 2, day 4 and day 7 after initiation of adipogenesis. Data are presented as means±SEM of three independent experiments with triplicates

