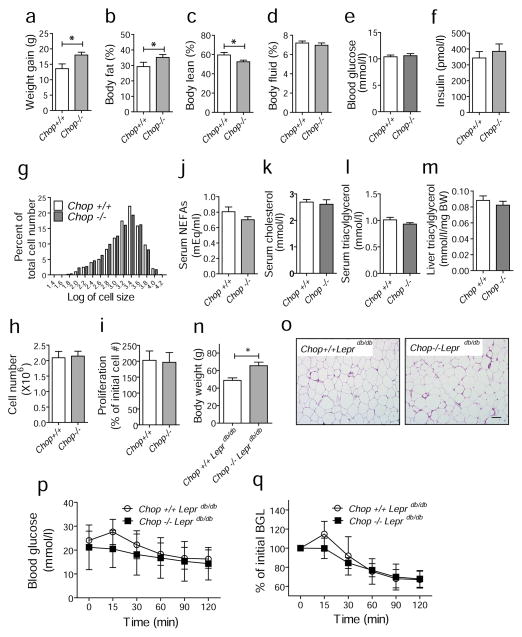
Fig. 6.
Chop deletion increases body fat mass in mice fed a HFD or in genetically obese Leprdb/db mice. (a–f) Weight gain, body fat mass, body lean mass, fluid mass, blood glucose and insulin levels. Chop+/+ (n=10) and Chop−/− (n=8) mice were fed an HFD for 13 weeks and weight gain, body fat mass, body lean mass and fluid mass were measured using an NMR-based analyser. (g) Histogram showing the distribution of adipocyte size in mice fed an HFD for 13 weeks. The x-axis represents the logarithm of cell size in pixels, while the y-axis shows the percentage of cells having a given size for each group of mice. White bars, Chop+/+; black bars, Chop−/−. (h) The number of cells from the SVF of adipose tissues from Chop+/+ (n=4) and Chop−/− (n=4) mice at the age of 6–8 weeks on regular diet. (i) Proliferation rate of cells from SVF. Cells from SVF were plated in replicate and the number of cells was counted after 4 days using an automated cell counter. Each suspension was counted twice. The y-axis represents the percentage of the initial cell number. Serum levels of NEFA (j), cholesterol (k) and triacylglycerol (l) from mice fed an HFD for 13 weeks. Sera from Chop+/+ (n=10) and Chop−/− (n=8) mice were collected and analysed. (m) Hepatic triacylglycerol levels. Liver samples were collected after 13 weeks of HFD for analysis. (n) Body weights of Chop+/+Leprdb/db (n=5) and Chop−/−Leprdb/db (n=5) mice at 6 months of age. (o) Representative images of epididymal fat pads from Chop+/+Leprdb/db and Chop−/−Leprdb/db mice at 6 months of age. Scale bar indicates 100 μm. (p, q) ITTs. Chop+/+Leprdb/db (n=5, circles) and Chop−/− Leprdb/db (n=5, squares) mice at 6 months of age were challenged with insulin (0.75 U/kg body weight) and blood glucose levels were measured. Data are presented as means±SEM. **p<0.01, *p<0.05. BW, body weight

