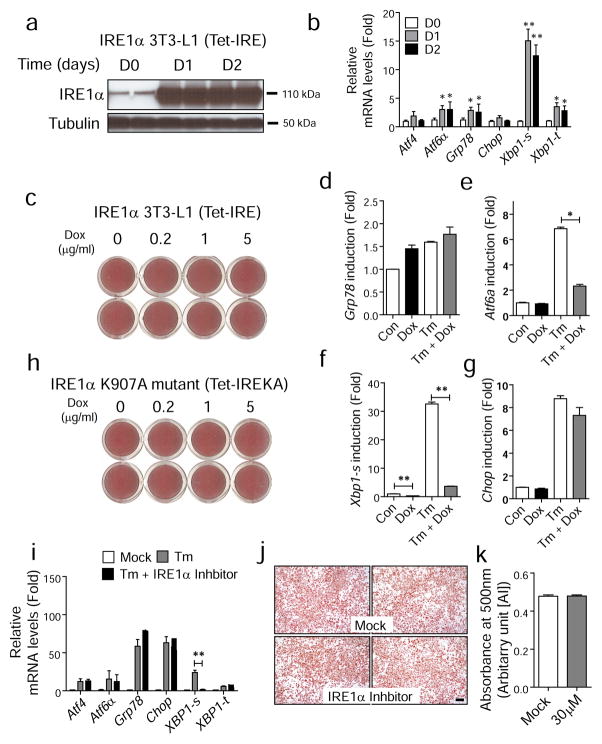
Fig. 7.
IRE1α signalling is not required for adipogenesis in vitro or in vivo. (a, b) Generation of 3T3-L1 cells that produce wild-type IRE1α under the control of a tetracycline-inducible promoter (Tet-IRE). Total protein lysates and total RNA were collected at indicated time points after doxycycline (5 μg/ml) treatment and analysed by western blot (a) and quantitative real-time PCR (b). White bars, day 0 (D0); grey bars, day 1 (D1); black bars, day 2 (D2). **p<0.01, *p<0.05 vs D0. (c) IRE1α overproduction does not affect adipogenesis. Differentiation was induced in Tet-IRE cells in the presence of doxycycline (Dox) at various doses. On day 10, cells were stained with Oil red O. Representative images from each condition are shown. (d–g) Gene expression profile for stable 3T3-L1 cells expressing dominant-negative mutant Ire1aK907A under the control of a tetracycline-inducible promoter (Tet-IREKA) in the absence or presence of Tm-induced ER stress. Data are presented as means±SEM of three independent experiments with triplicates. (h) Images of Oil red O staining for 3T3-L1 cells expressing mutant Ire1aK907A under the same conditions as (d–g). (i) Quantitative real-time RT-PCR to verify IRE1α inhibition. 3T3-L1 cells were treated with Tm (2 μg/ml) in absence (grey bars) or presence of IRE1α inhibitor (30 μmol/l, black bars) for 16 h for analysis of gene expression. ‘Mock’ indicates DMSO treatment (white bars). (j) Oil red O staining. Adipogenesis was stimulated in 3T3-L1 cells in the absence (vehicle) or presence of IRE1α inhibitor (30 μmol/l). On day 10, cells were fixed and stained with Oil red O. Representative images are shown. Scale bar indicates 100 μm. (k) Quantification of Oil red O staining is shown in right panel. Data are presented as means±SEM. **p<0.01, *p<0.05. AU, arbitrary units

