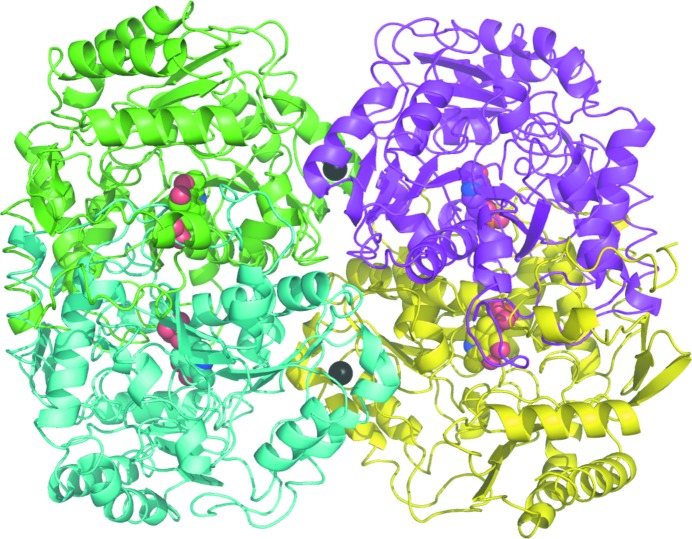
Figure 2.
A ribbon diagram of the P. aeruginosa β-A:PyAT tetramer viewed approximately along the molecular dyad. The individual subunits are shown in different colours. The cofactor PLP is shown as a space-filling model and the two calcium ions on the interface of the catalytic dimers are shown as black spheres. Figs. 2–7 were prepared using PyMOL (DeLano, 2002 ▶).

