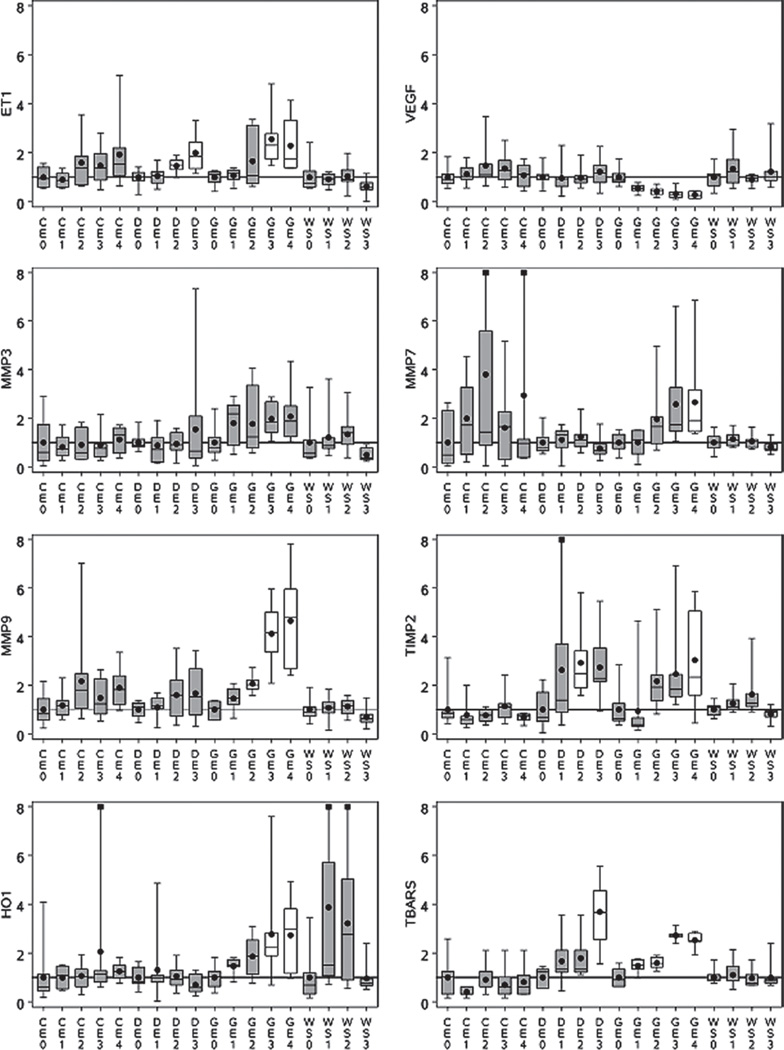
Figure 1.
Observed response patterns for response indicators. Data are expressed as fractions of individual study control mean values. Horizontal bars in boxes represent 25th and 75th percentiles and medians; dots depict mean values. Narrow vertical lines depict data ranges (maximum and minimum). Squares at maximum indicate a value above 8. Horizontal axis provides experimental group (CE, GE, WS, DE) and exposure designations (0 = control, 1 = low concentration, 2 = mid concentration, 3 = high concentration, 4 = high concentration with particle filtration). Boxes without shading indicate a statistically significant (p < 0.05) difference from the study control mean by Dunnett’s multiple comparison test.

