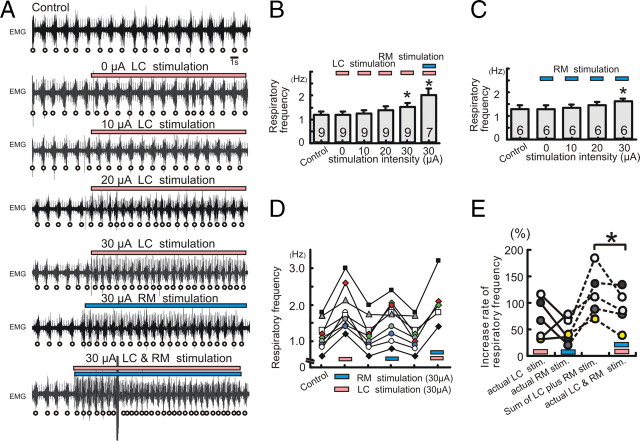
Figure 6.
Electrical stimulation of LC or RM facilitates respiratory activity in an intensity-dependent manner. A, EMG activity obtained from intercostal muscles under control condition (top trace), in the presence of 0 μA LC stimulation (second trace), 10 μA LC stimulation (third trace), 20 μA LC stimulation (fourth trace), 30 μA LC stimulation (fifth trace), 30 μA RM stimulation (sixth trace), and 30 μA LC plus RM stimulation (bottom trace). B, C, Bar graphs illustrating that electrical stimulation of LC (pink bar) and/or RM (blue bar) increase respiratory activity in an intensity-dependent manner (B and C, *p < 0.05). D, Graph illustrating that the effect on respiratory activity is completely reversible upon termination of the stimulation (pink bar, LC; blue bar, RM stimulation). E, Graph illustrating the percentage increases in respiratory frequency caused by separate LC stimulation (pink bar) and RM stimulation (blue bar), the sum calculated from the sum of each of these separate stimulations, and the actual increases caused by the simultaneous stimulation of LC and RM. Each dot represents a stimulation experiment. Experiments conducted in the same animals are connected by lines.

