Figure 1.
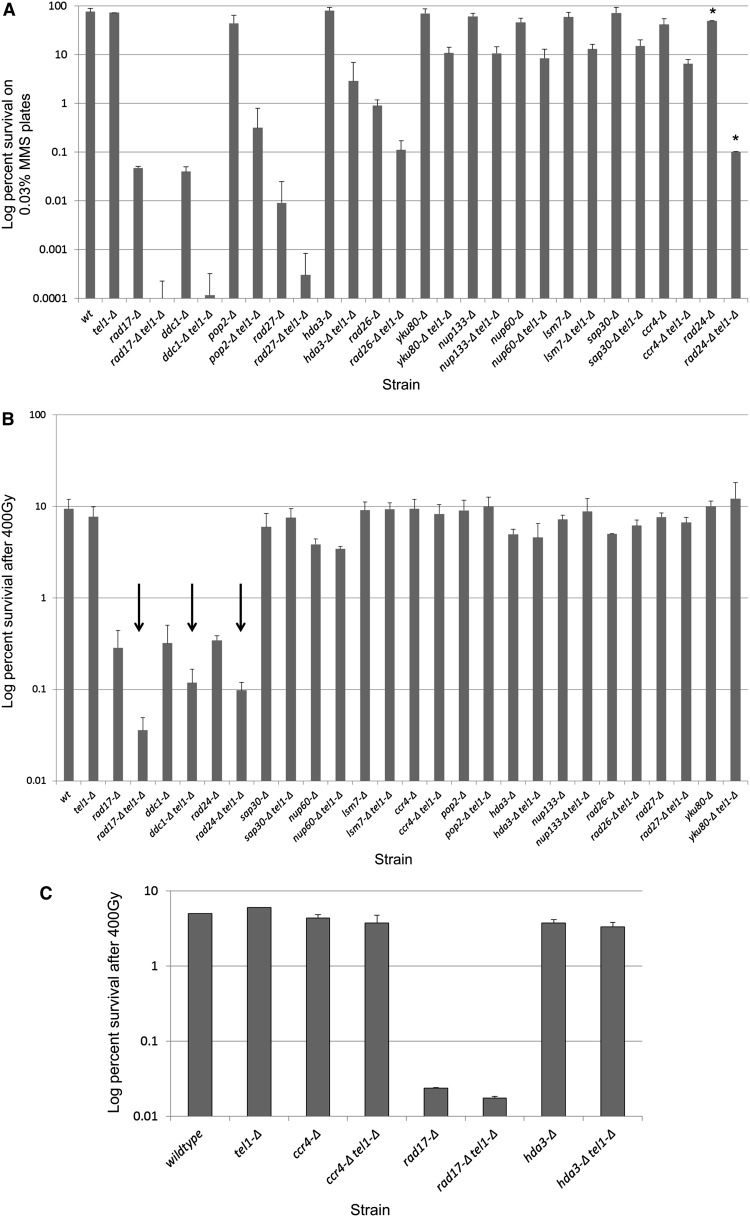
Quantitative survival analysis for tel1 interactions in MMS and IR via colony-forming assay. (A) Quantitative survival analysis in MMS. Log-phase cultures for three independent transformants of each single and double mutant were serially diluted in PBS and spread onto YEPD or YEPD + 0.03% MMS plates (asterisks indicate that screening was done in 0.015% MMS due to extreme MMS sensitivity). Viable cells were determined by the number of CFU after 3 days at 30°. (B) Quantitative survival analysis in IR. Log-phase cultures for three independent transformants of each single and double mutant were serially diluted in PBS and spread onto YEPD plates and irradiated at 400 Gy at 8 Gy/min. Viable cells were determined by the number of CFU after 3 days at 30°. Arrows indicate interactions identified in the genome-wide screen. Error bars represent the standard deviation of values from three independent transformants. (C) Quantitative survival analysis using continuous low-dose-rate IR. Log-phase cultures for two independent transformants of each single and double mutant were diluted in YEPD in 15-ml tubes and irradiated with 400 Gy delivered at a continuous dose rate of 0.9 Gy/min over 7.5 hr. Following delivery of IR, cells were counted, serially diluted, and plated for colony survival analysis. Error bars show the range of values for two independent transformants.

