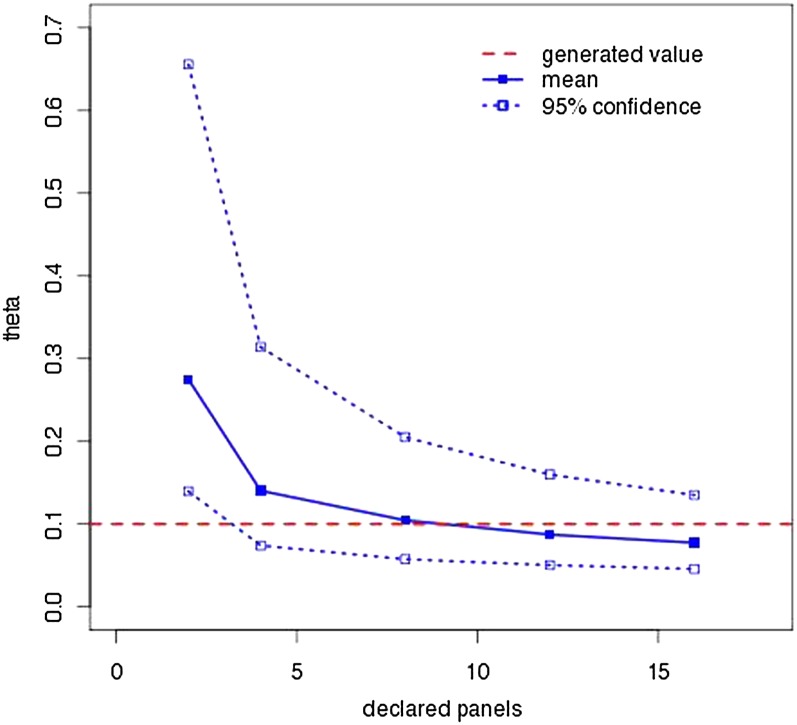
Figure 4.
Effect of incorrect panel sizes on MPE and credibility intervals. One hundred data sets generated with and eight panels were analyzed using LAMARC with different declared panel sizes. The solid line and points are the average MPE; the dotted lines and outline points enclose the average 95% credibility interval. The horizontal dashed line indicates the 0.1 Θ used in generating the data.

