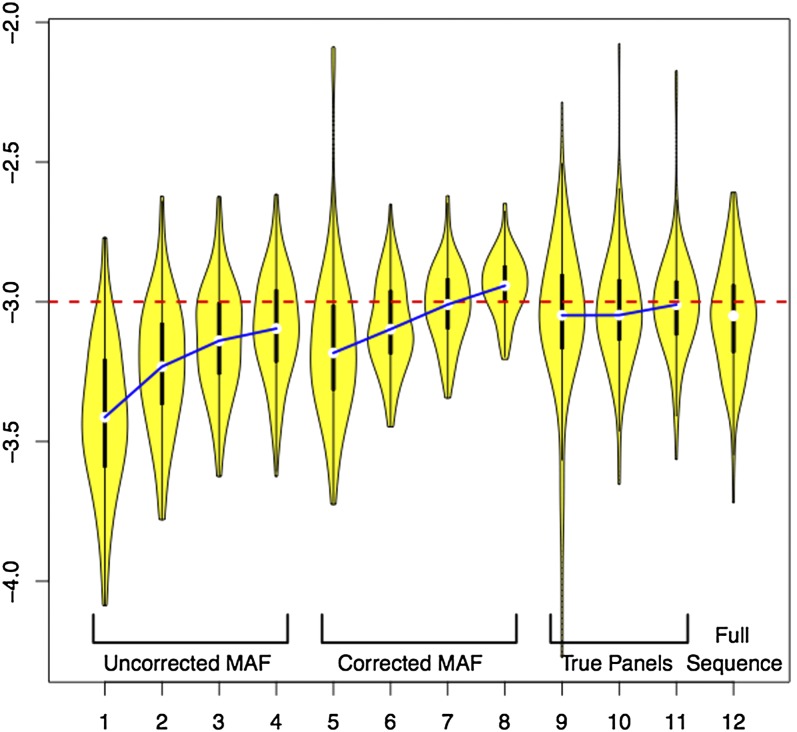
Figure 5.
Distribution of MPE of Θ for different panel corrections. Violin plots show the log base 10 of the distribution of recovered Θ-estimates for the runs in Table 5. Medians of analyses using the same corrections and data ascertainment schemes are linked for clarity.

