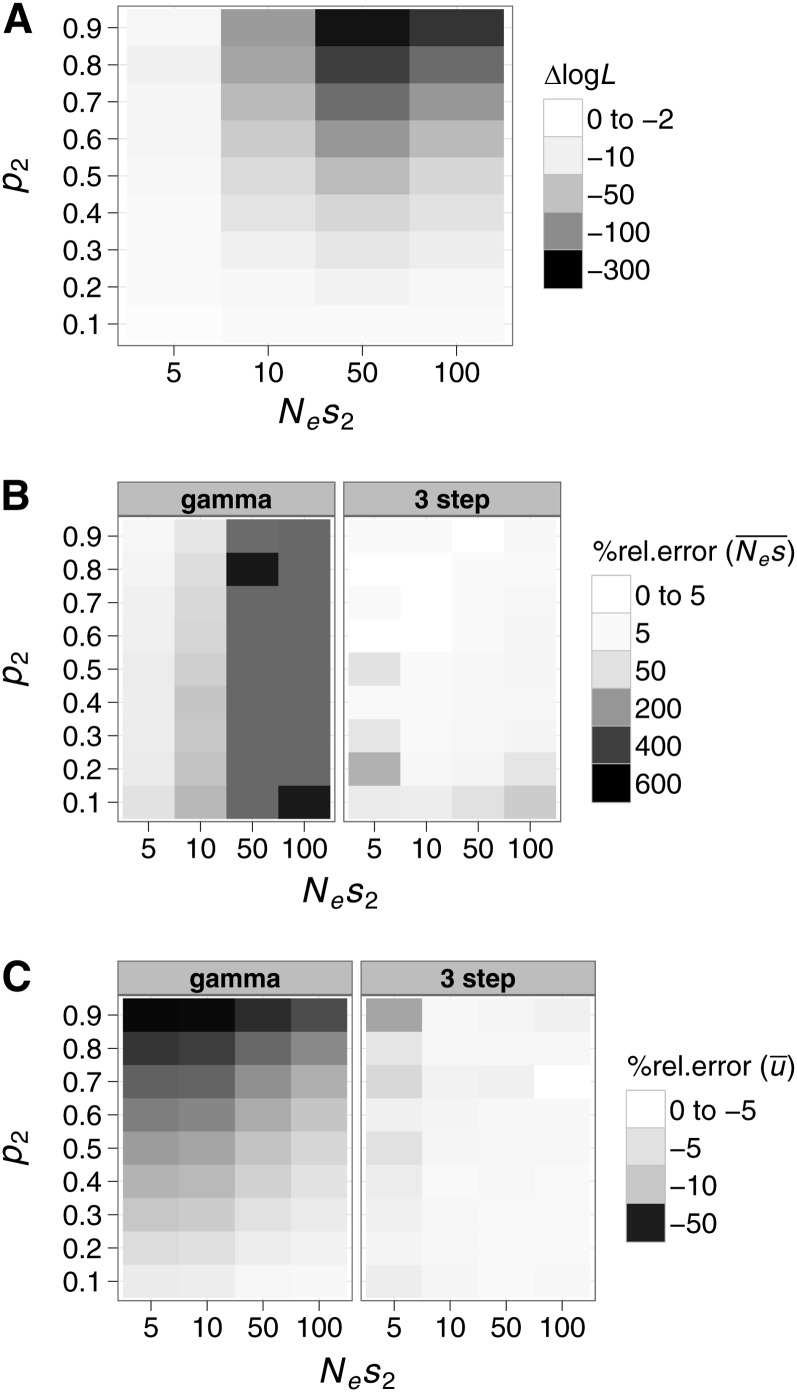
Figure 4.
The performance of the gamma and three-step models when fitted to bimodal DFEs. We simulated two-spike DFEs with one spike fixed at Nes1 = 0 and we varied the selection strength (Nes2) and probability density (p2) of the second spike. (A) ΔlogL between the three-step and gamma models fitted to the simulated DFEs as a function of Nes2 and p2. We also compared the % rel. error in estimating (B) and (C) . Positive and negative values of % rel. error signify overestimation and underestimation of these parameters, respectively.

