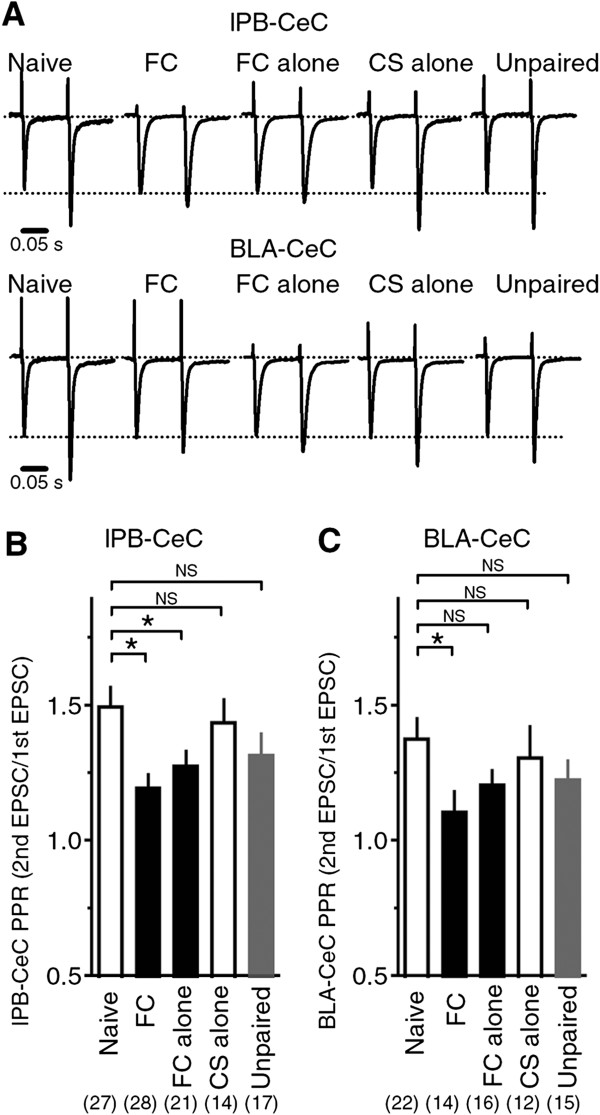
Figure 3.
Paired-pulse ratio in lPB-CeC and BLA-CeC pathways. A, Representative traces (average of eight consecutive EPSCs) of scaled lPB-CeC EPSCs (top) and BLA-CeC EPSCs (bottom) from each group of mice. B, Averaged paired-pulse ratio (PPR) evoked by paired stimuli (100-ms interstimulus interval) in lPB-CeC synapses. Note that the PPR was significantly reduced in FC mice (n = 28) and FC alone mice (n = 21) compared with naive mice (n=27), but CS alone (n = 14) and unpaired (n = 17) mice displayed an indistinguishable PPR compared with naive mice, analyzed with post hoc Dunnett’s t-test following ANOVA. C, Averaged PPR evoked by paired stimuli (100-ms interstimulus interval) in BLA-CeC synapses. Note that the PPR was significantly reduced in FC mice (n = 28) compared with naive mice (n = 27), but FC alone (n = 21), CS alone (n = 14) and unpaired (n = 17) mice showed indistinguishable PPR compared with naive mice, analyzed with post hoc Dunnett’s t-test following ANOVA.

