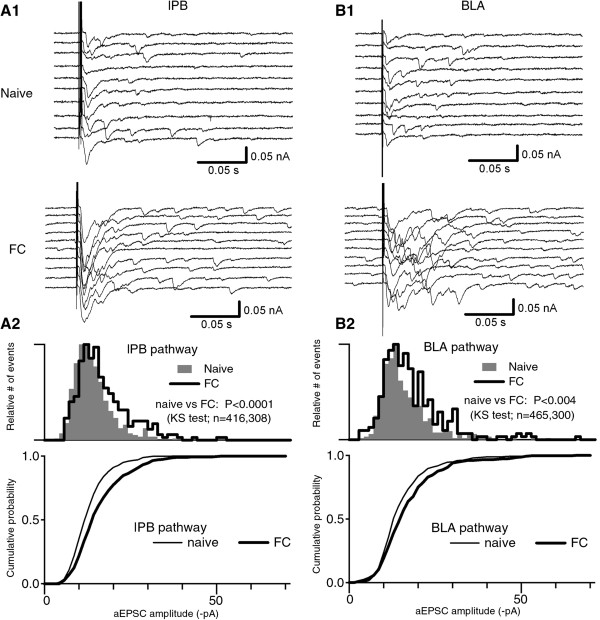
Figure 7.
Asynchronous EPSC amplitudes in lPB-CeC and BLA-CeC synapses. A1 and B1, Representative traces using strontium solution (5 mM Sr2+, 0 mM Ca2+) in lPB-CeC (A1) and BLA-CeC (B1) synapses from naive (top panels) and FC (bottom panels) mice. A2andB2, Histograms (top panels) and cumulative plots (bottom panels) of the asynchronous EPSC (aEPSC) amplitudes in lPB-CeC (A2) and BLA-CeC (B2) synapses. Note that aEPSCs with larger amplitude emerged in FC mice so that the relative amplitude histograms were skewed towards the right. The distribution was significantly different in both lPB-CeC (p < 0.0001) and BLA-CeC (p < 0.004) synapses.

