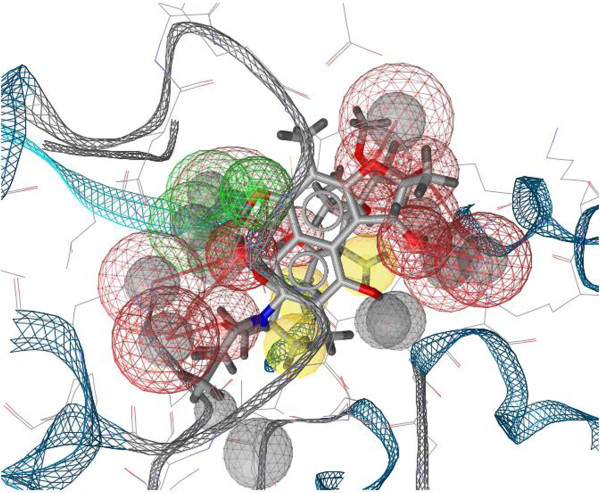
Figure 4.

3D interaction map presenting molecular interactions between RPO active site and Rifampicin. Green spheres show Hydrogen Bond Acceptors (HBA) and red spheres show Hydrogen Bond Donors (HBD). Hydrophobic interactions are represented by yellow spheres.
