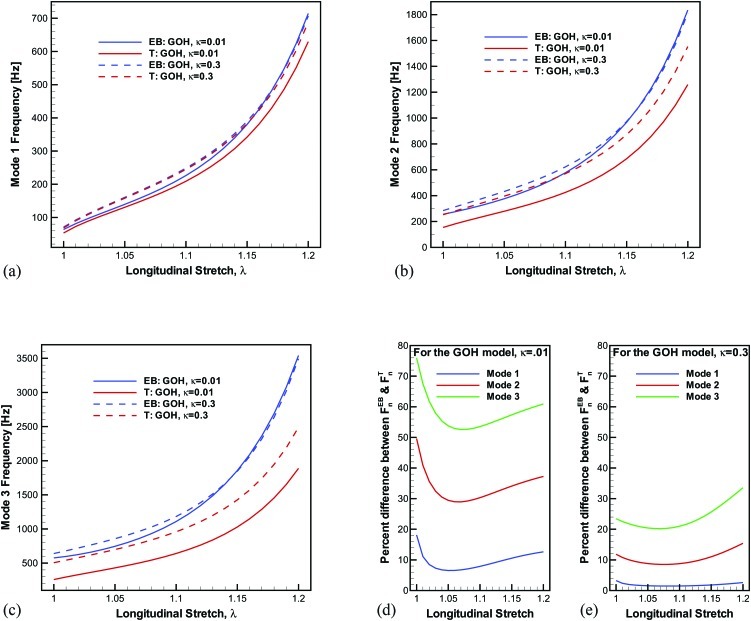
Figure 6.
Euler–Bernoulli and Timoshenko beam model predictions for the extreme cases of near perfectly aligned fibers (κ = 0.01) and near isotropy (κ = 0.3). (d) and (e) show the percent difference of the frequency predictions from the Euler–Bernoulli and Timoshenko beam models for κ = 0.01 and κ = 0.3, respectively.

