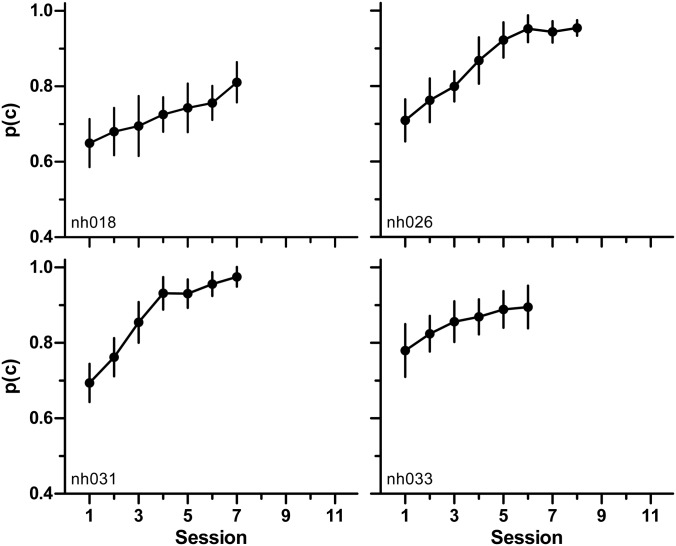
Figure 4.
Recognition of CRM sentences processed by TF masks during the training phase. Each panel presents data for 1 of the 4 listeners in Group 1, for whom TF masks were generated with RC = +10 dB. Symbols show the mean word recognition score calculated across all the blocks in a daily session. Error bars are standard deviations.

