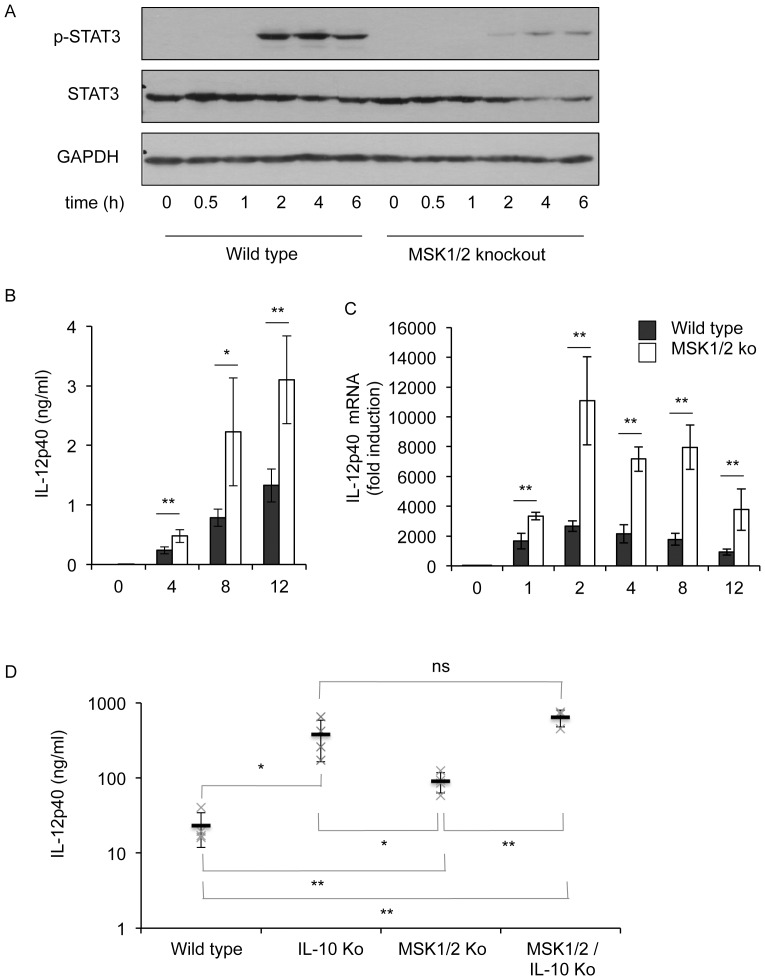
Figure 8. Zymosan induces STAT3 phosphorylation via IL-10.
(A) BMDMs were isolated from wild type or MSK1/2 knockout mice and stimulated for the indicated times with 200 µg/ml zymosan. Cells were lysed and the levels of total and phospho (Y705) STAT3 as well as GAPDH were determined by immunoblotting. (B, C) BMDMs from either wild type or MSK1/2 knockout mice were stimulated for the indicated times with 200 µg/ml zymosan. Secreted IL-12p40 protein (B) and IL-12p40 mRNA (C) levels were determined. (D) Wild type, IL-10 knockout, MSK1/2 double knockout or MSK1/2/IL-10 triple knockout BMDMs were treated with 200 µg/ml zymosan for 8 h. Secreted IL-12p40 levels were then determined. The average for each genotype is shown by a bar and the BMDMs from individual mice by X. Error bars (B–D) represent the standard deviation of independent cultures from 4 mice per genotype. P values (Student's t-test) of less than 0.05 are indicated by * and less than 0.01 by **.

