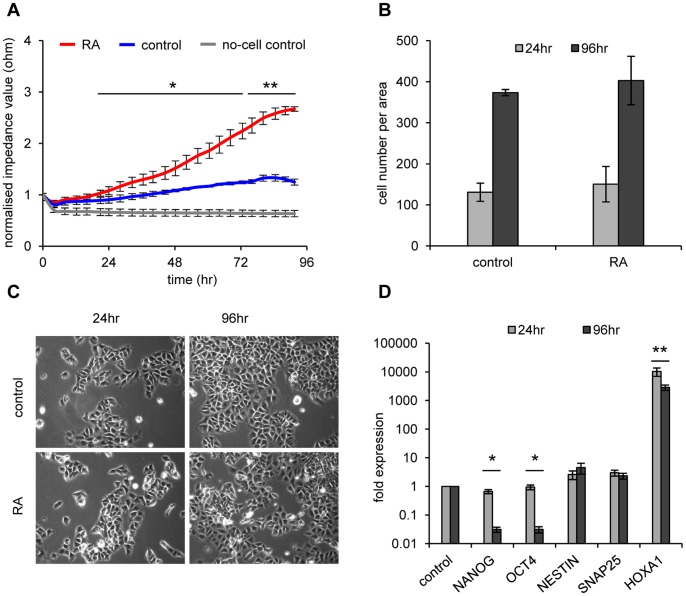
Figure 1. Retinoic acid induced neuronal differentiation of NT2 EC cells.
(A) Impedance profiles comparing RA-induced (10 µM - red) and untreated NT2 cells (blue) during a 4 day period. The mean of three independent experiments is shown. Standard deviations are indicated by error bars every four hours. Measurements were executed at 45 kHz in 5-minute intervals for 96 hours. Normalised resistance values were compared by two-tailed Student’s t-test. After 20 hours of RA treatment differences in impedance values start to become statistically significant (*p<0.05, **p<0.005). Black lines show regions with significant differences in respect to the untreated cell control. (B) Average cell numbers of three replicates of untreated and RA-treated NT2 cells after 24 and 96 hours do not differ significantly. Standard deviations are indicated by error bars. (C) Microscopic images (10× magnification) of NT2 control cells and NT2 cells treated with RA for 24 and 96 hours. No clear differentiation phenotype becomes apparent for the RA treatment. (D) qRT-PCR expression analysis of stem cell factors NANOG, OCT4 and the differentiation markers NESTIN, SNAP25 and HOXA1 in RA- treated and control cells after 24 and 96 hours of treatment. Data is shown in logarithmic scale. Only HOXA1 is prominently induced by retinoic acid at both time points. The stemness genes are only found reduced after 96 hours of RA treatment. All qRT-PCR measurements were repeated at least three times and internally normalised to the corresponding β-actin values. Standard deviations are indicated by error bars. Two-tailed student’s t-test showed significant differences when comparing expression levels of OCT4, NANOG and HOXA1 at 24 hours with the expression levels at 96 hours. (*p<0.05, **p<0.005).

