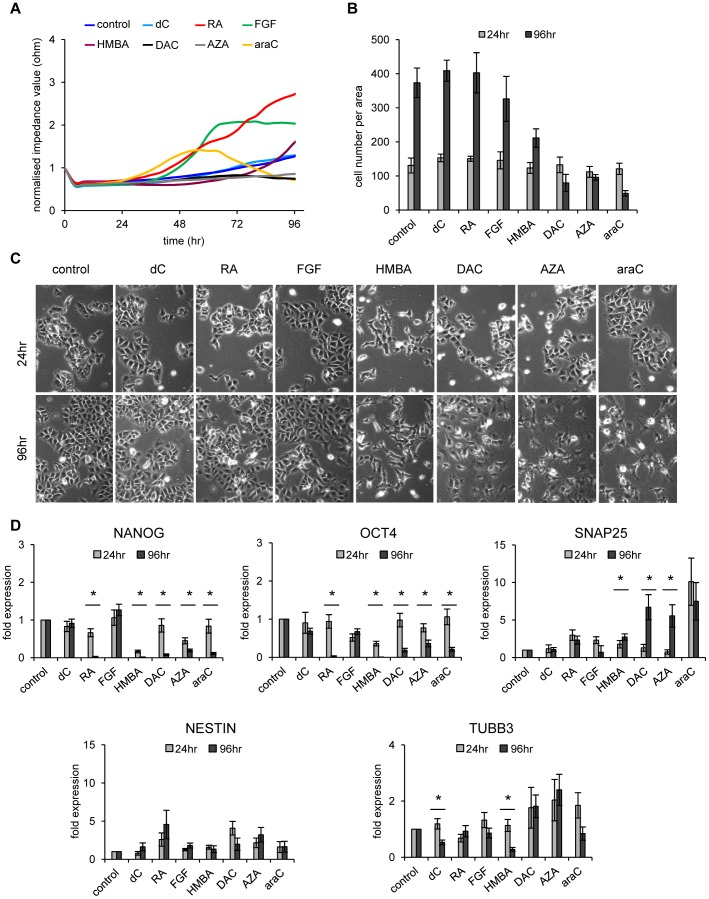
Figure 3. Induced differentiation by a defined panel of drugs.
(A) Impedance profiles comparing NT2 cells treated with retinoic acid (RA, 10 µM), hexamethylene bisacetamide (HMBA, 5 mM), 5-azacytidine (AZA, 1 µM), deoxycytidine (dC, 1 µM), fibroblast growth factor 2 (FGF, 50 µM), 2′-deoxy-5-azacytidine (DAC, 1 µM) and 1β-arabinofuranosylcytosine (araC, 1 µM) during a 4 day period. Measurements were executed at 45 kHz in 5-minute intervals for 96 hours. The mean of three independent experiments is shown. Standard deviations are not shown to avoid crowding of the diagram. For single diagrams including standard deviations and statistical tests for these data sets see Fig. S2. (B) Average cell numbers of three replicates of untreated and treated NT2 cells after 24 and 96 hours. Nucleoside drugs are cytotoxic at the concentrations used and show significant growth inhibition. Standard deviations are indicated by error bars. (C) Microscopic images (10× magnification) of NT2 control cells and NT2 cells treated with the various substances mentioned in (A) after 24 and 96 hours of treatment. (D) qRT-PCR expression analysis of stem cell factors NANOG, OCT4 and the differentiation markers NESTIN, SNAP25 and TUBB3 in treated and NT2 control cells after 24 and 96 hours of treatment. All qRT-PCR measurements were repeated at least three times and internally normalised to the corresponding β-actin values. Standard deviations are indicated by error bars. Treatments showing significant differences comparing expression levels at 24 hours with those at 96 hours are marked with an asterisk (two-tailed student’s t-test; p<0.05).

