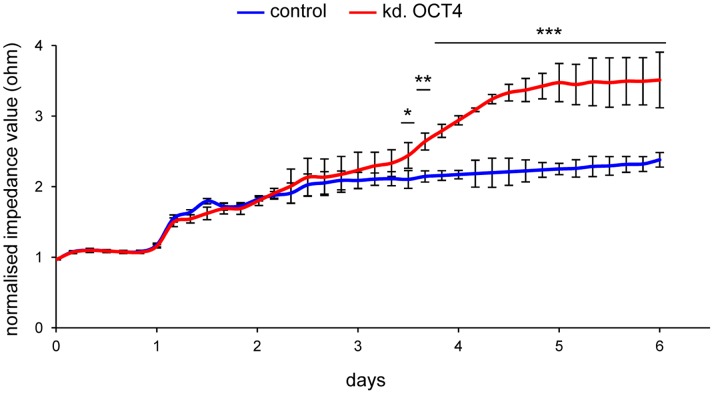
Figure 5. Induced differentiation by RNAi-mediated depletion of OCT4.
Impedance profiles of control NT2 cells (blue - scrambled knock down) and NT2 cells depleted for OCT4 (red) during a 6 day period. Measurements were executed at 45 kHz in 5-minute intervals for 6 days. The mean of three independent experiments is shown. Standard deviations are indicated by error bars every four hours. Student’s t-test was used for statistical analysis. Differences between control and knock down experiments in the indicated regions have been found to be statistically significant (*p<0.05, **p<0.005, ***p<0.001).

