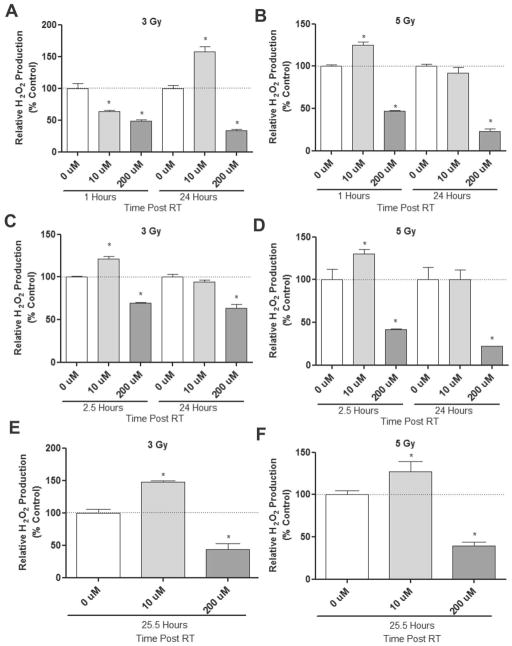
Figure 2.
At neutral pH CONPs generally decrease RT-induced H2O2 production. (A & B) CONP suspensions of serial concentrations up to 200 μM in water or PBS at neutral pH (Figure S2) were irradiated at indicated doses. H2O2 production was determined at indicated time points post-RT (see response to all the concentrations and time-course response in Figure S1A & S1B). (C&D) Water was irradiated at indicated doses. After 1 hour CONPs were added up to 200 μM. H2O2 production was then determined at indicated time points post-RT (see response to all the concentrations in Figure S1C & S1D). (E&F) Water was irradiated at indicated doses. After 24 hours CONPs were added up to 200 μM. H2O2 production was then determined at indicated time points post-RT (see response to all the concentrations in Figure 21E & S1F).*P<0.05 compared to 0 μM CONP at that time point.

