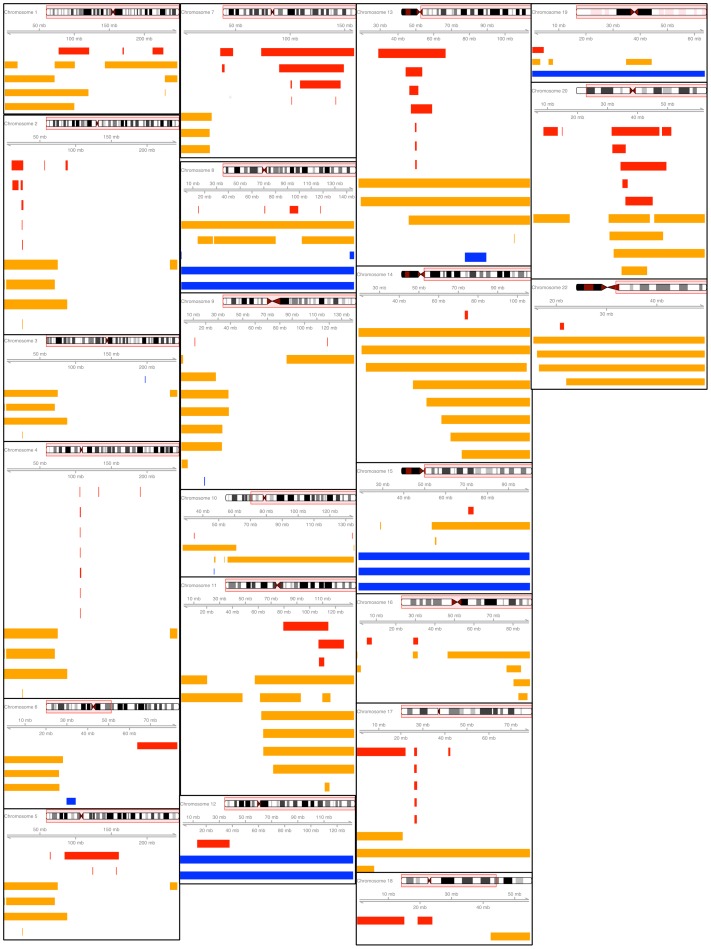
Figure 2. Mosaic anomalies plotted across chromosome in megabases (mb) by estimated copy change from disomic state (red = loss, dark blue = gain, orange = copy neutral loss of heterozygosity).
The red box around the ideogram represents the region of interest for the plot located below. Chromosome 21 is omitted due to the absence of detected mosaic anomalies on the chromosome. (Note: plots are not drawn to scale).

