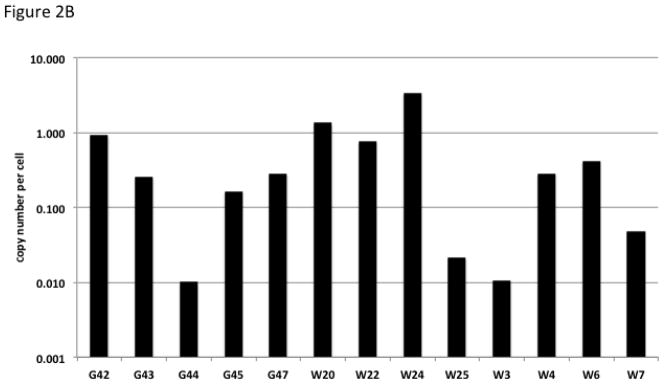
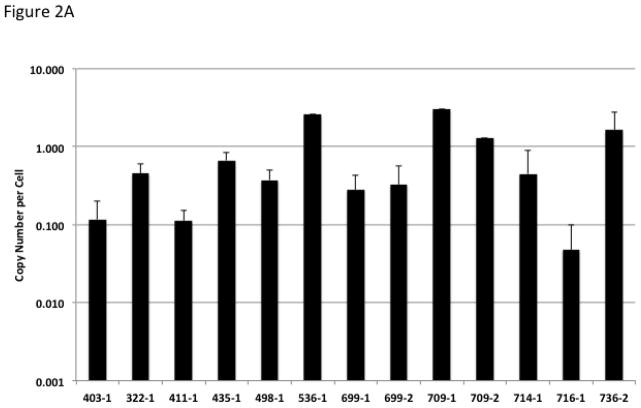
Figure 2.

Copy Number Estimate for Transgenic Animals. (A) Values represent the vector copy number per cell for transgenic fetuses. Fetuses had between one and eight organs available for analysis, the standard deviation is displayed for fetuses in which multiple organs were analyzed. Error bars represent standard deviation of the mean for animals with multiple organs available for analysis. (B) Values represent the vector copy number per cell from blood of transgenic lambs.

