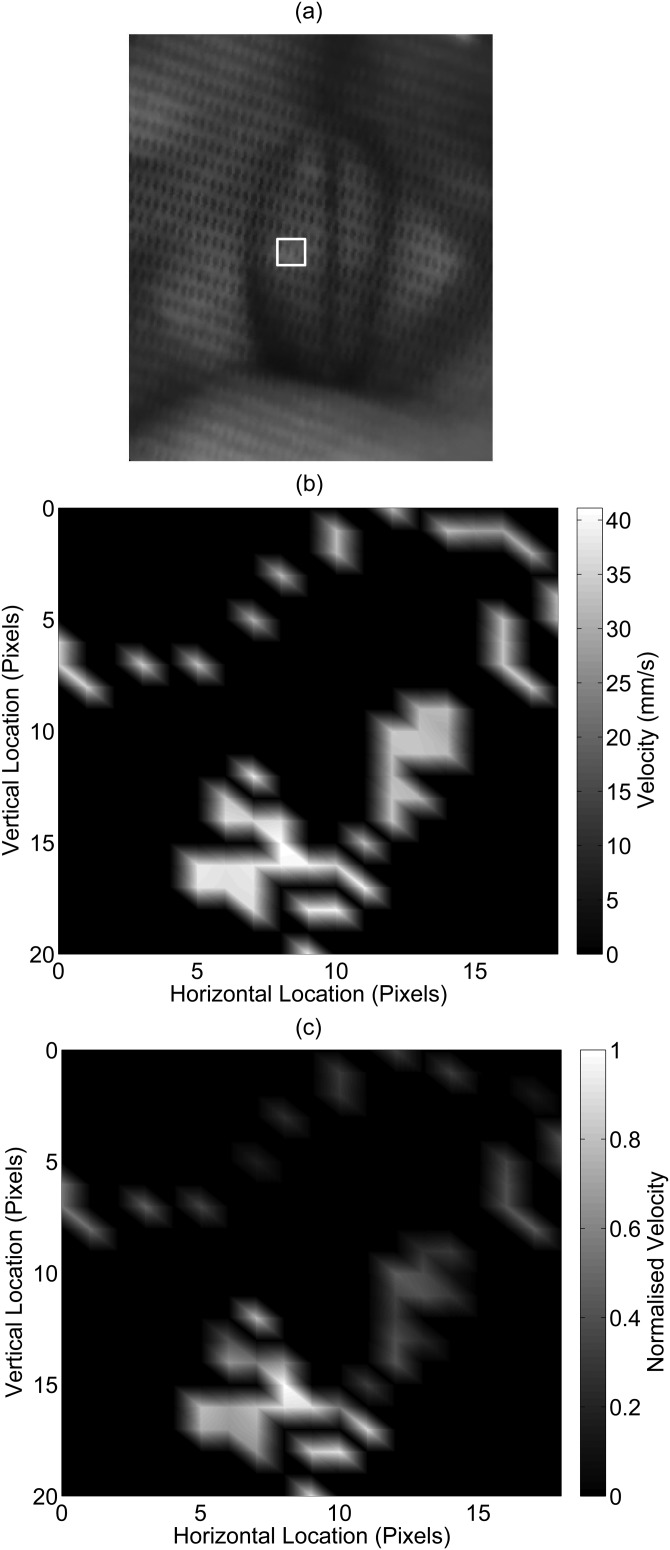
Figure 10.
An example case of a vocal fold velocity map. (a) The highlighted region in the endoscopic image indicates the velocity map boundaries. The velocities are shown as (b) absolute mm/s units and (c) normalized units, where 1 = maximum velocity amplitude and 0 = minimum velocity amplitude. The velocities shown were averaged if a pixel location was measured more than once in the given phonation time record.

