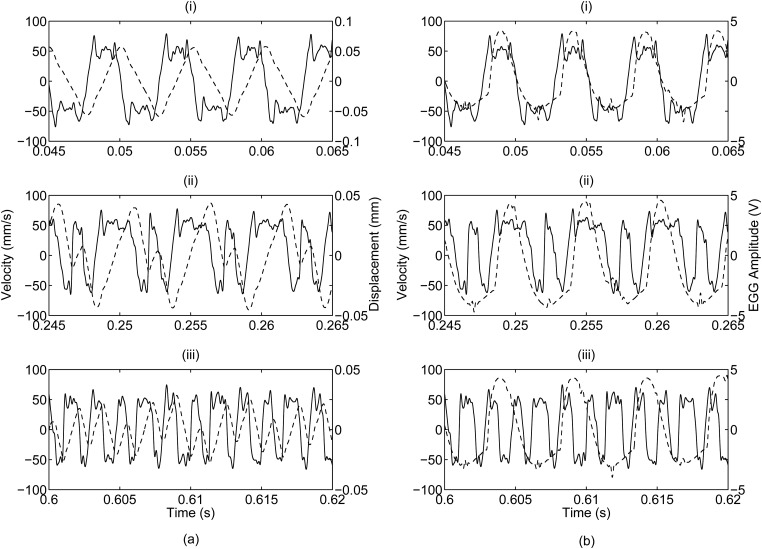
Figure 7.
Time record representations of three distinct velocity waveforms that were consistently found in the data records. The solid line depicts the velocity profile and the dotted line depicts (a) the displacement profile and (b) the EGG signal. The waveforms, identified as (i) Shape A, (ii) Shape B, and (iii) Shape C, are progressively more complex. The progression of the three shapes is illustrated in Fig. 11.

