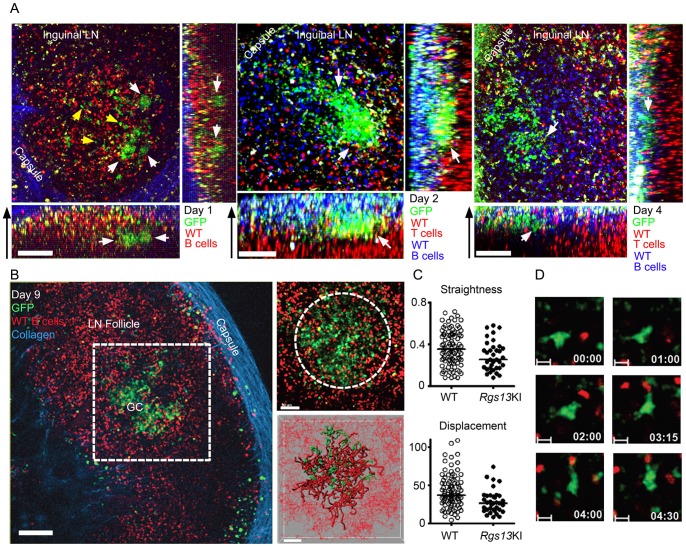
Figure 4. Rapid induction of GFP expression in vivo following immunization.
A. Intravital TP-LSM of the inguinal LN of KI mice immunized with sRBCs 1, 2, or 4 days previously. The day prior to imaging labeled B cells or labeled B and T cells from non-immunized WT mice were transferred to outline LN follicle and T cell zone, respectively. Shown are X, Y; X, Z (below); and Y, Z (right) projections from an image stack collected on the indicated day. Clusters of GFP positive cells shown with white arrow and GFP positive cells in the follicle delineated by yellow arrows. B. Intravital TP-LSM of the inguinal LN of a KI mouse immunized with sRBC 7 days previously. The day prior to imaging splenic B cells from a non-immunized WT mouse were adoptively transferred to outline the LN follicle. The left image shows GFP expression, the transferred WT B cells (red), and collagen (blue). The middle two images show the region subjected to analysis and tracks of the WT B cells (red) and the endogenous GFP expressing cells present in the KI mice. C. Track analysis of GFP+ KI B cells in the GC region versus WT B cells within the follicle. Statistical significance of straightness and displacement was calculated by Mann Whitney test. (*; p<0.05, **; p<0.01) D. Electronically zoomed time lapse images from GFP+ KI B cell in the GC from part B intravital TP-LSM imaging.

