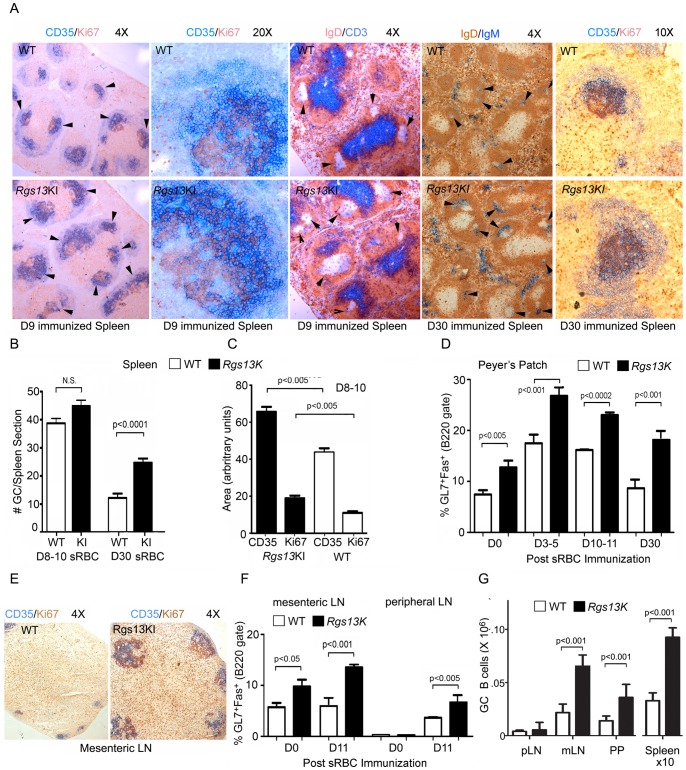
Figure 5. Large GCs in Rgs13GFP KI mice.
A. Brightfield microscopy of representative spleen sections from day 9 and 30 sRBC immunized WT and KI mice using antibodies against CD35 and Ki67, IgD and CD3, or IgM and IgD. In some sections GCs are indicated with arrowheads. B. Quantification of the number of GCs per spleen section from WT and KI mice 8–10 or 30 days post-immunization with sRBCs. Eight WT and 8 KI mice (8–10 day) and 4 WT and 4 KI mice (day 30) immunostained for Ki67 and CD35 were used. Data is mean ± SEM. Statistics, unpaired t test. C. Quantification of CD35 and Ki67 immunostaining of individual GCs from WT and KI spleen sections prepared from 8–10 day post immunized animals. Data is mean ± SEM of the areas from CD35 and Ki67 immunostaining of 50 WT and KI GCs (unpaired t test). D. Flow cytometric analysis of B220+CD38−GL7+CD95+ cells in Peyer's patches from WT and KI mice prior to and post sRBC immunization. Data is % of B220 gate and is the mean ± SEM of 8 v. 8, 11 v. 11, 8 v. 8, and 4 v. 4 WT and KI mice at 0, 3–5, 10–11, and 30 days post immunization, respectively. Results compared by unpaired t test. E. Brightfield microscopy of representative mesenteric LNs from WT and KI mice using antibodies against CD35 and Ki67. F. Flow cytometric analysis of B220+CD38−GL7+CD95+ cells in mesenteric and peripheral LNs from WT and KI mice prior to and post sRBC immunization. Data is % of B220 gate and is the mean ± SEM of 4 WT v. 4 KI mice at each time point. Results compared by unpaired t test. G. Flow cytometric enumeration of B220+CD38−GL7+CD95+ cells in peripheral LNs (pLN), mesenteric LNs (mLN), Peyer's patches (PP) and the spleen from chimeric mice (CD45.1 versus CD45.2) 9 days post sRBC immunization. Data is mean ± SEM of cells recovered from 4 chimeric mice. Results are compared by unpaired t test.

