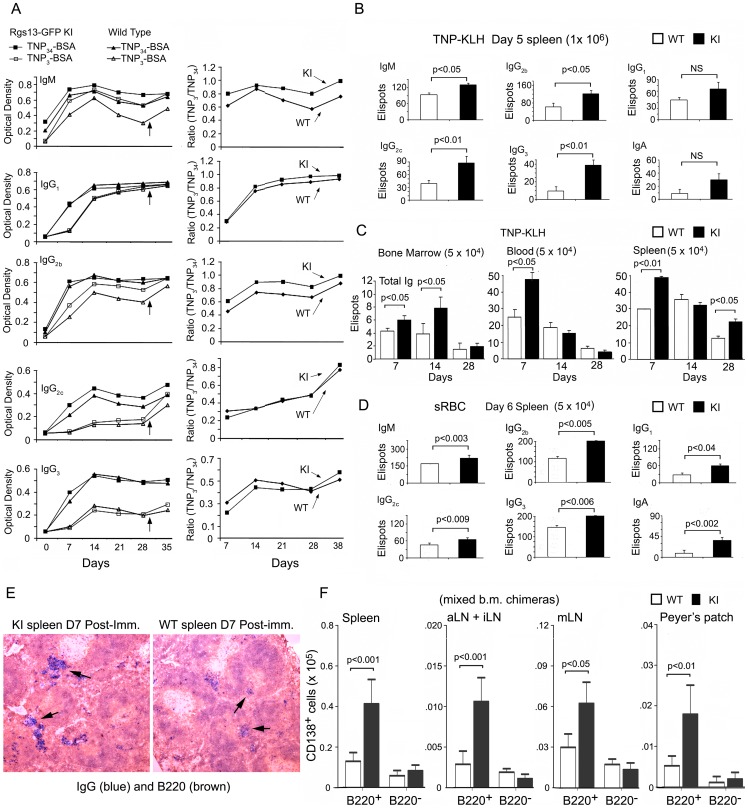
Figure 7. Enhanced early antibody response in the Rgs13GFP KI mice.
A. ELISA assay results from analysis of sera collected at the indicated days from WT and KI mice immunized subcutaneously with TNP-KLH in complete Freund's adjuvant and boosted at day 28. IgM, IgG1, IgG2b, IgG2c and IgG3 specific antibodies at each time point were assayed with plates coated with TNP34BSA or TNP3BSA (left panels). The ratios between the TNP3 and TNP34 responses are shown (right panels) for the WT and KI mice. Results are from 4 WT versus 4 KI mice. Similar results were obtained from 2 additional experiments. B. ELISPOT assay results from analysis of spleen cells from 2 WT and 2 KI mice immunized 5 days previously with TNP-KLH. Similar results in 2 other experiments. Data is mean ± SEM and statistics from unpaired t tests. C. ELISPOT assay results from analysis of bone marrow, blood, and spleen cells at the indicated time points following immunization with TNP-KLH. The numbers of TNP specific ELISPOTs are shown from 1 experiment comparing 2 WT versus 2 KI mice. Similar results from one other experiment. Data is mean ± SEM and statistics from unpaired t tests. D. ELISPOT assay results from analysis of spleen cells from 2 WT and 2 KI mice immunized 6 days previously with sRBCs. Similar results in 1 other experiment. Data is mean ± SEM and statistics from unpaired t tests. E. Representative brightfield microscopy images of WT and KI spleen sections immunostained for IgG (blue) and B220 (brown). F. Flow cytometric quantification of the number of CD138+B220+ and CD138+B220− B cells at D11 post-immunization with sRBCs in the spleens, axillary and inguinal LNs, mesenteric LNs, and Peyer's Patches of 4 mice reconstituted with a 1∶1 mix of WT and KI bone marrow 8 weeks after reconstitution. Data is mean ± SEM and statistics from unpaired t tests.

