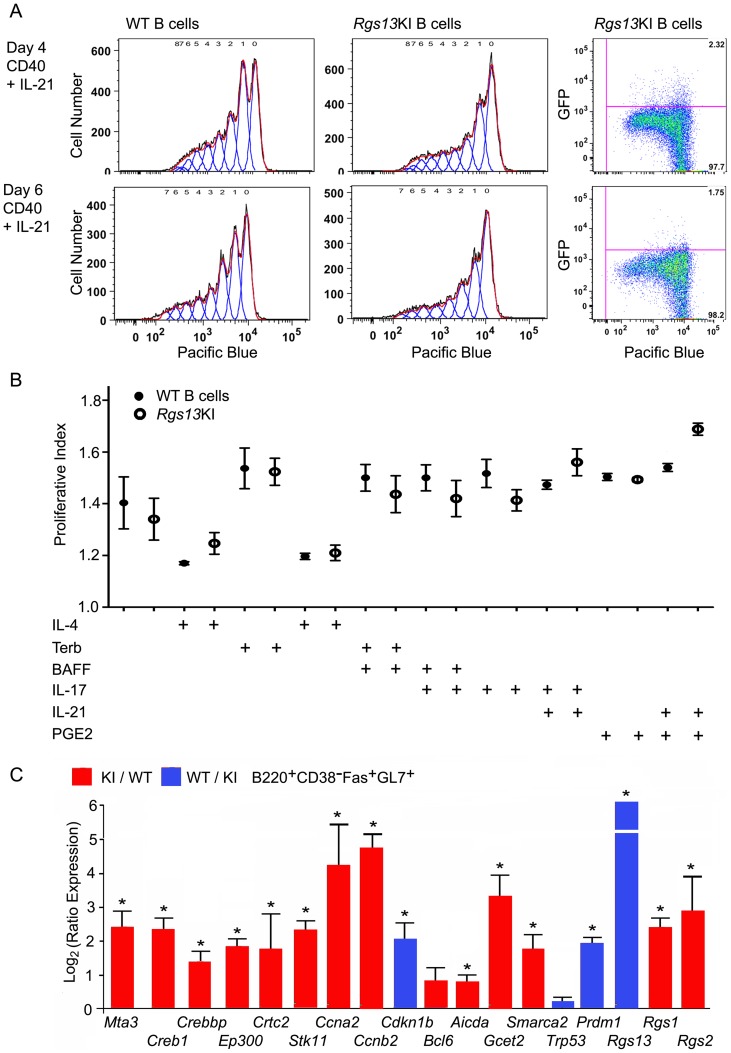
Figure 8. Normal B proliferation in vitro, but an abnormal gene expression pattern in Rgs13GFP KI GC B cells.
A. Flow cytometric analysis of WT and KI splenic B cell proliferation following stimulation with CD40 and IL-21 for 4 or 6 days. Proliferation assessed by Pacific Blue dye dilution. Representative results from the analysis of B cells from 3 WT and 3 KI mice. An analysis of GFP versus Pacific blue for the KI B cell is shown in the far left panels. B. Proliferative indexes from the flow cytometric analysis of WT and KI mouse spleen B cells stimulated as indicated. Results mean ± SEM of 3 WT versus 3 KI B cell preparations. Similar results from 2 other experiments using a partial overlapping set of inductive signals. C. Quantitative RT-PCR using RNA extracted from spleen cells from 10 day sRBC immunized KI/WT mixed chimera mice sorted for B220+CD38−GL7+CD95+ and separated on the basis of CD45.1 or CD45.2. Results were normalized to Gapdh expression and expressed as ratio between KI and WT samples. Data are the mean ± SEM of triplicate values for each gene analyzed using data pooled from 3–4 separate experiments.

