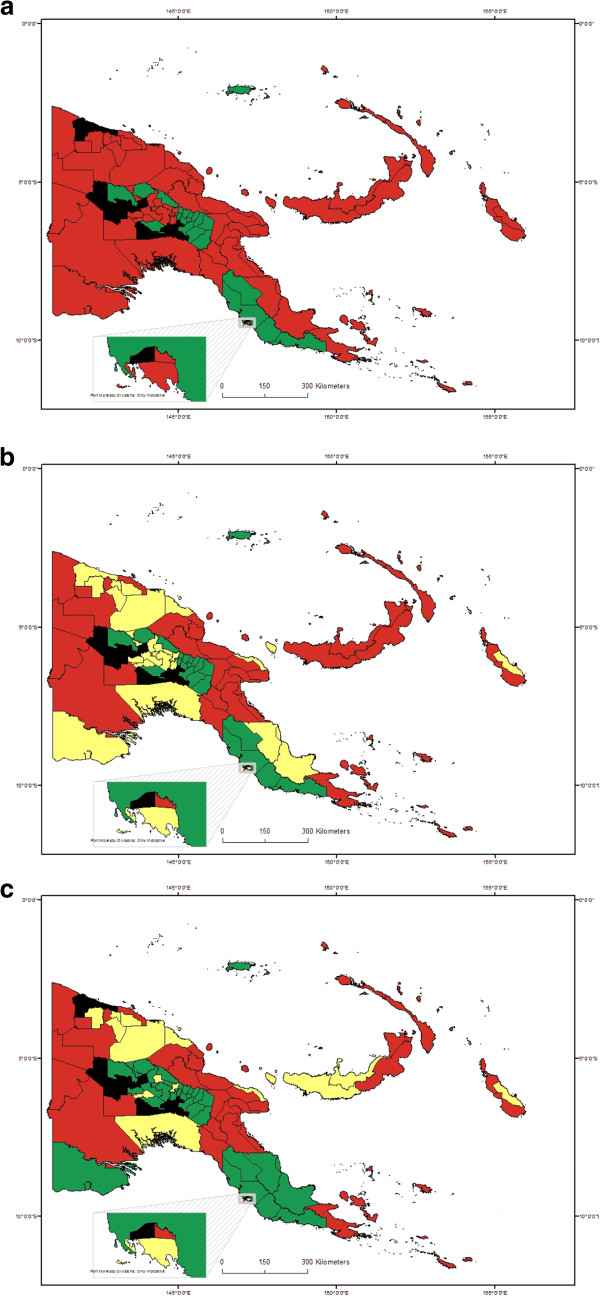
Figure 3.
Maps showing classification of districts by endemicity, according to three criteria schemes. a. Map with districts classified using GPELF criteria scheme 1. Red: endemic, >0% pos; Green: non-endemic, 0% pos; Black: unknown; results from all types of test. b. Map with districts classified using modified GPELF criteria scheme 2. Red: High endemic, ≥5% pos; Yellow: Low endemic, >0% and <5% pos (or unknown but all adjacent districts >0%); Green: non-endemic, 0% pos; Black: unknown; results from all types of test. c. Map with districts classified using alternative criteria scheme 3. Red: high endemic; ≥5% pos; Yellow: low endemic, ≥1% and <5% pos; Green: non-endemic, <1% pos; Black: unknown; Mf results used if available, otherwise ICT.

