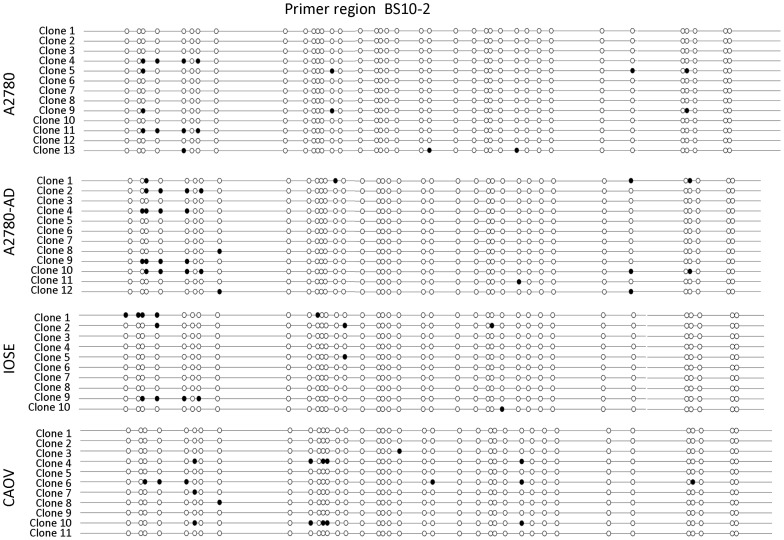
Figure 4. Bisulfite sequencing of RGS10-1 promoter.
RGS10 promoter genomic DNA was aligned with individual sequences of cloned PCR products from primer pair BS10-2 amplification of bisulfite treated genomic DNA from the indicated cell lines. Sequences were subjected to quality control analysis and aligned using BiQ Analyzer software. In this conventional ‘lollipop’ representation, each CpG site in the region (−121,303,076 → −121,302,726) is indicated with a circle; filled circles are methylated, unfilled circles are unmethylated. Lollipop representations of the methylation status of each CpG site in RGS10-1 promoter regions amplified by BS10-1, BS10-3, and BS10-4 primer sets are available in the Supporting Information.

