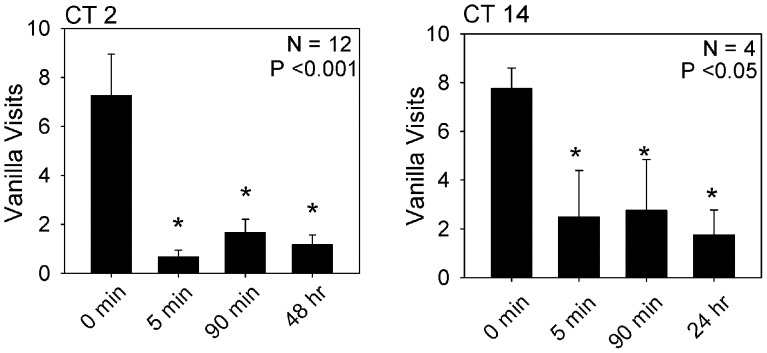
Figure 4. Plots vanilla visits as a function of training/testing time when the peppermint odor was paired with the positive reinforcement of sucrose solution and the vanilla odor was paired with an accessible negative reinforcement of saline.
Left panel, training at CT 2; right panel training at CT 14. P-values for the ANOVA are indicated in the figure. Bars marked with * indicate a statistically significant difference (p<0.05) when compared to the initial number of vanilla visits (Holm-Sidak post-hoc test).

