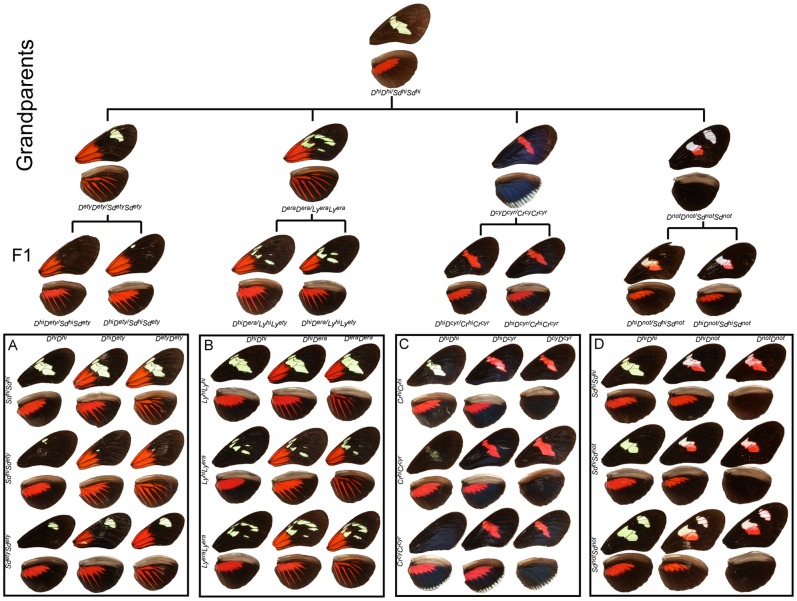
Figure 1. Crossing strategy and color pattern variation.
Mendelian segregation of the major color pattern genes in H. erato as seen in our collection of crosses. Four distinct geographic races (from left H. e. etylus (A), H. e. erato (B), H. e. cyrbia (C), and H. e. notabilis (D)) were crossed to H. himera (top) to generate backcross (BC) and F2 mapping families. The nine major phenotypes produced by the segregation of alternative alleles at major loci are arranged in each box with D (top) and Sd, Ly, Sd, and Cr (left) with contributions from H. himera (top and left) and H. erato (bottom and right). Heterozygotes for these major color pattern loci are found in the middle column and row with double heterozygotes in the center. Inferred genotypes are indicated across the top and on the side of each box (see text for details).

