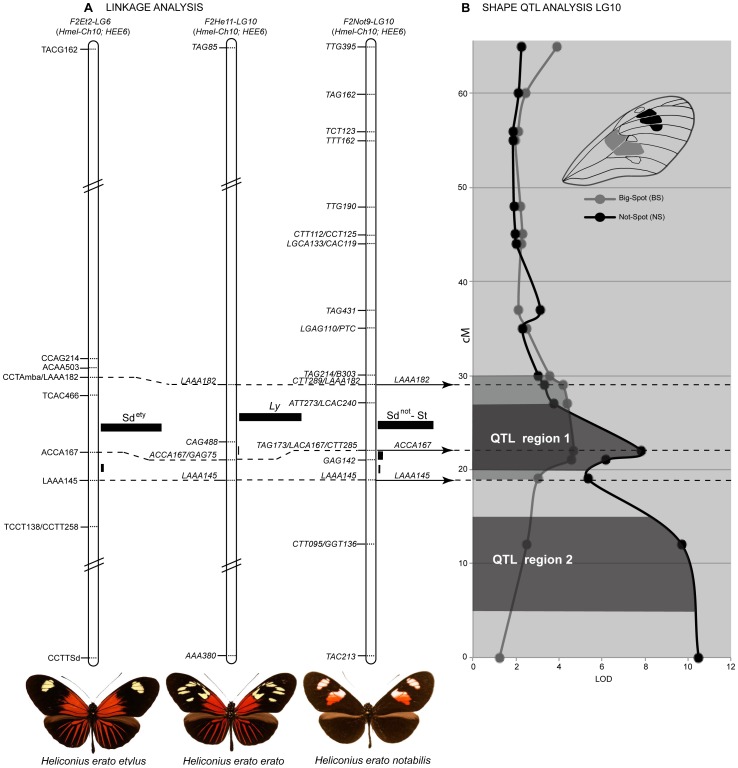
Figure 6. A single locus controls variation in the forewing black patterns of the H. erato radiation.
(A) Linkage analysis of forewing black pattern variation segregating in three types of H. himera×H. erato F2 crosses. The dotted lines connect anchor AFLP loci indicating that the loci responsible for much of the variation in forewing band shape maps to homologous genomic intervals. The linkage analysis for the best placement of Sdety was published in Kapan et al. (2006) while the genetic map of the other three loci Ly, Sdnot and St is novel to this study. For each linkage analysis the black bars represent the probability of placement of each gene in a particular interval (see Kapan et al. 2006), while on the right side of the figure the overall probability for the best placement assuming a single locus affects these melanic patterns in all three crosses. (B) The effect of LG 10 on quantitative variation size of the lower (BS = grey line) and upper (NS = black line) forewing band is shown. For the lower band, there is evidence for a single QTL centered at Sd (WntA) that explains near 1/3 of the variation in the size of the band (QTL region 1). For the upper band, epistatic interaction between possibly two linked QTLs (QTL region 1 and QTL region 2) on LG 10 explain over 82% of the observed variation (see Table 1 and Table S8).

