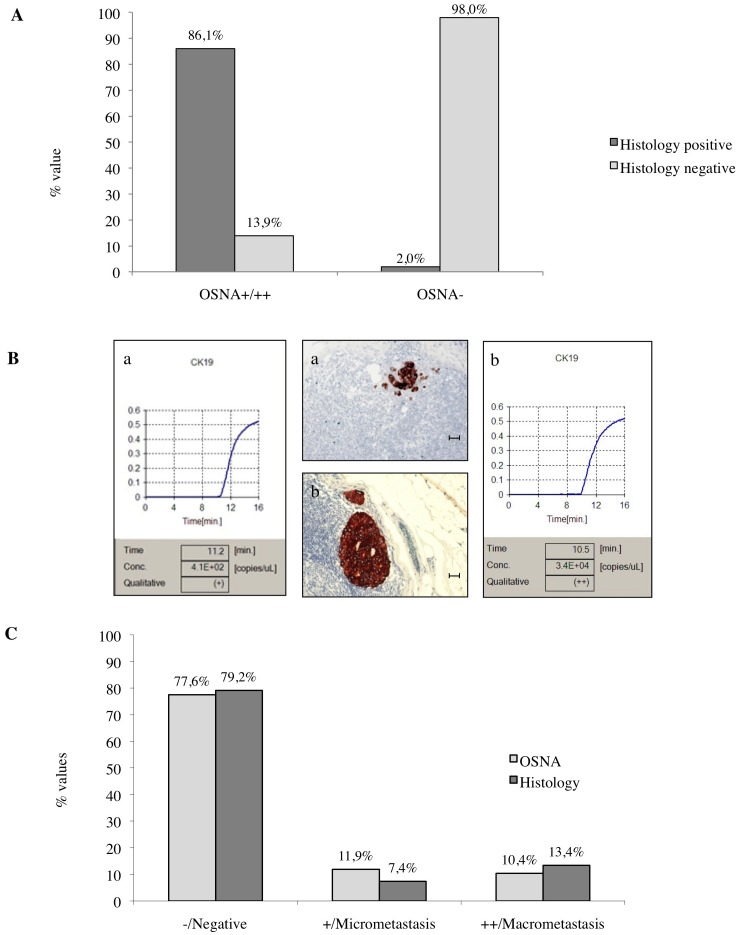
Figure 1. Correlation between OSNA assay and histology results in the entire series of 903 SLNs. Panel A:
The histograms summarize the percentage of concordant and discordant results on SLNs analyzed by OSNA and histology. Panel B: Representative examples of CK19 immunostaining (immunoperoxidase) of a micrometastasis (a) and a macrometastasis (b) in two different SLNs compared to the matched OSNA curves (a-b) (scale bar = 90 µm). Panel C: The histograms show the distribution of −/negative, +/micrometastatic and ++/macrometastatic SLNs analyzed both by molecular and morphological methods. The percentage of micrometastases by OSNA was 11.9% and by histology 7.4%, whereas the percentage of macrometastases by OSNA was 10.4% and by histology 13.4%. Histology included H&E staining and IHC. OSNA−: <250; OSNA+ : >250≤5000; OSNA++: >5000 CK19 mRNA copies/µl.

