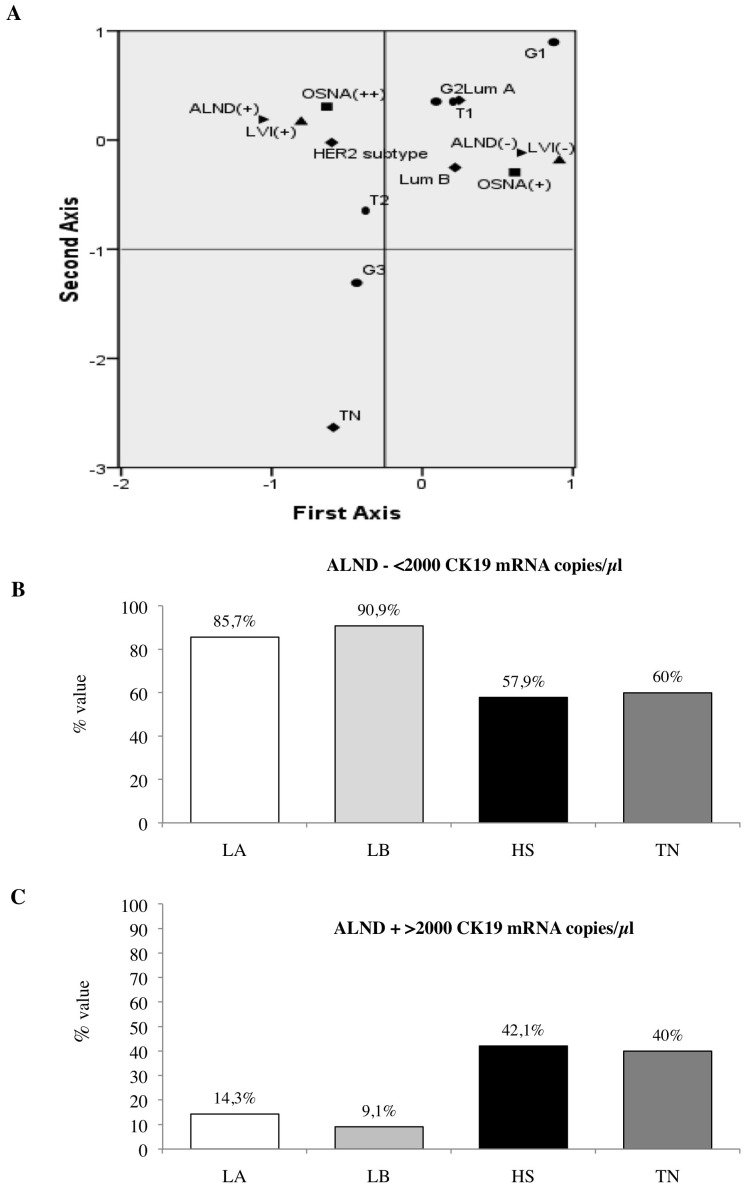
Figure 4. MCA of the 179 OSNA +/++ BC patients stratified by molecular subtypes and relationship between BC subtypes and ALND status in the subset of 91 OSNA+ BC patients.
Panel A: The MCA graph demonstrates that ALND (+) is located in the quadrant containing the most aggressive phenotypes (T2 tumors, positive LVI, HER2 subtype, OSNA++) in contrast to ALND (−) which is associated to more favourable bio-pathological parameters (T1 tumors, absence of LVI, LA subtype). *LA: Luminal A; LB: Luminal B; HS: HER2 subtype; TN: Triple Negative Panel B : The histograms report the distribution of molecular subtypes in the 72 OSNA+ cases with ALND negative and CK19 mRNA <2000 copies/µl (range 270–1900). Panel C : The histograms report the distribution of molecular subtypes in the 19 OSNA+ cases with ALND positive and CK19 mRNA >2000 copies/µl (range 2100–4600).

