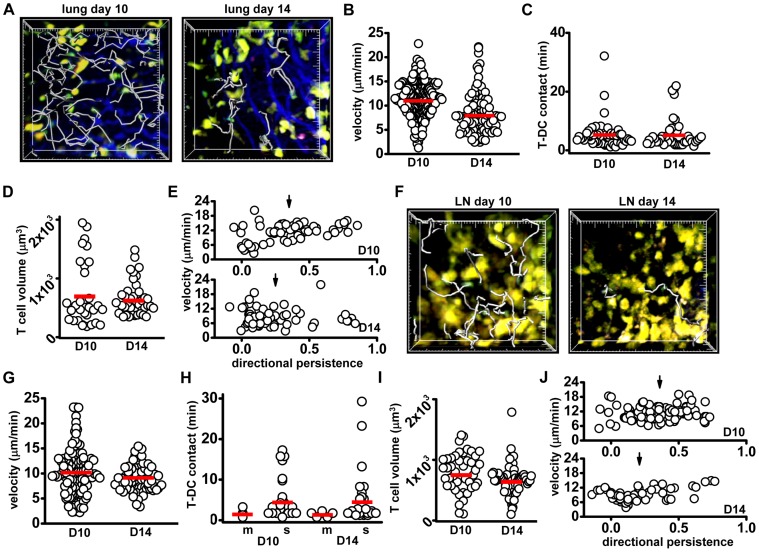
Figure 4. T and DC behavior in the lung and lymph node during the Maintenance phase.
(A) Images of DCs (yellow) and T cells (green) in the lung 10 and 14 days after influenza infection; tracks (grey) represent 16.5 min of T cell movement, large tick marks = 20 μm. (B) T cell velocities in the lung on day 10 (11.2±0.22 µm/min) and day 14 (8.3±0.4 µm/min, p<0.01). (C) T-DC contact durations in the lung on day 10 (5.8±0.9 min) and day 14 (5.7±0.8 min; p = 0.5, not significantly different). (D) T cell volumes in the lung on day 10 (721±98 µm3) and day 14 (652±45 µm3, p = 0.5, ns). (E) T cell directional persistence in the lung (plotted against velocity) on day 10 (0.35±0.03) and day 14 (0.25±0.03, p = 0.01). (F) Images of T cells in the lymph node on day 10 and day 14. Tracks (grey) represent 16.5 min, large tick marks = 20 μm. (G) T cell track velocities in the lymph node on day 10 (10.0±0.4 µm/min) and day 14 (9.0±0.3 µm/min; p = 0.03). (H) T cell contact durations with motile DCs on day 10 (1.8±0.6 min) and day 14 (1.7±0.2 min, p = 0.7, ns); and with sessile DCs on day 10 (4.8±1 min) and day 1 (4.7±0.8 min, p = 0.35, ns). (I) T cell volumes in the lymph node on day 10 (796±48 µm3) and day 14 (669±32 µm3, p = 0.02). (J) Directional persistence plotted against velocity for day 10 (dp = 0.36±0.02) and day 14 (dp = 0.21±0.03, p<0.01). Velocity correlates with directional persistence in day 14 T cells (PCC = 0.47, p<0.01). Data from each tissue were pooled from 3-4 separate experiments; each individual dot represents the behavior of a single cell, bars represent the mean.

