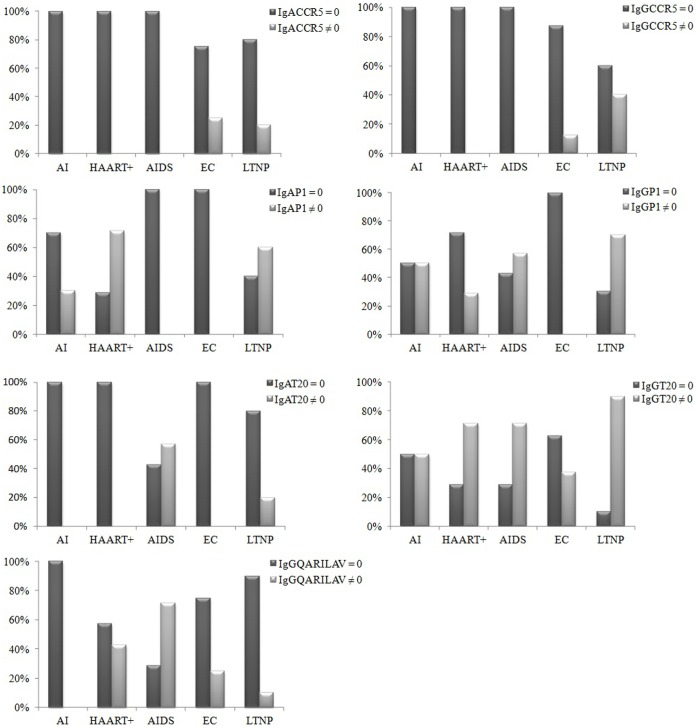
Figure 1. Distribution of binding antibodies in all studied groups.
Graphical representation of non-continuous variables, i.e. parameters found in some subjects or groups only. Seven variables, including IgG and IgA to specific gp41 epitopes (P1, T20, QARILAV) and antibodies to CCR5 coreceptor. First bar in each pair shows proportion of values found equal to 0 in the analysis, the second illustrates values different from 0. Chi-square association test between categorical variables only found a significant association between IgGT20 and IgGP1 (p-value = 0.001).

