
Figure 2. Histogram of the number of steps detected from 100 realizations of the simulated traces.
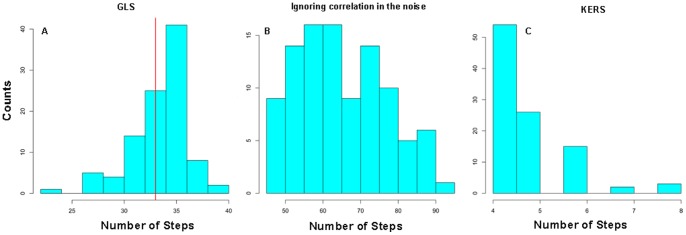
(A), (B) and (C) show the results from GLS method, GLS method but ignoring the correlation in the noise and KERS method, respectively.
Official websites use .gov
A
.gov website belongs to an official
government organization in the United States.
Secure .gov websites use HTTPS
A lock (
) or https:// means you've safely
connected to the .gov website. Share sensitive
information only on official, secure websites.
(A), (B) and (C) show the results from GLS method, GLS method but ignoring the correlation in the noise and KERS method, respectively.