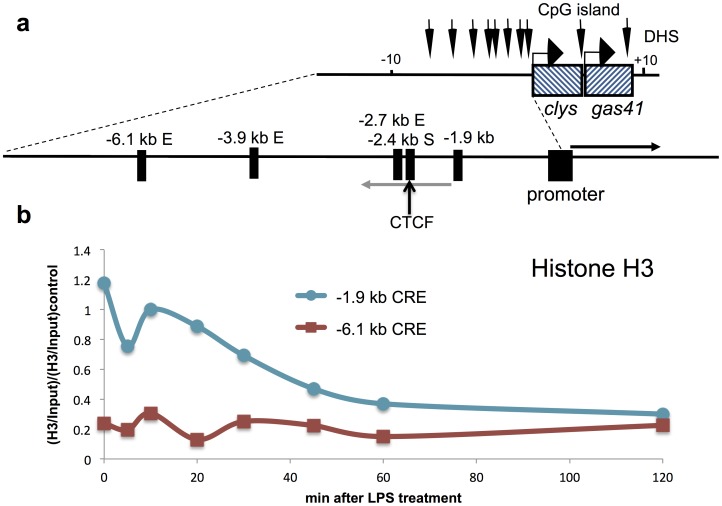
Figure 1. Rapid nucleosome loss at the−1.9 kb CRE in macrophages after LPS treatment.
(a) Illustration of the chicken lysozyme locus including cis-regulatory elements and the approximate location of LINoCR transcript, grey arrow and cLys mRNA, black arrow [7]. (b) ChIP assay performed with anti-histone H3 antibody at the −1.9 kb element compared to the −6.1 kb enhancer after LPS treatment in macrophages. Horizontal axis represents time after LPS induction in minutes. Data are normalised versus input and then versus a positive control region. Data are representative of at least three independent experiments.

