
Figure 1.
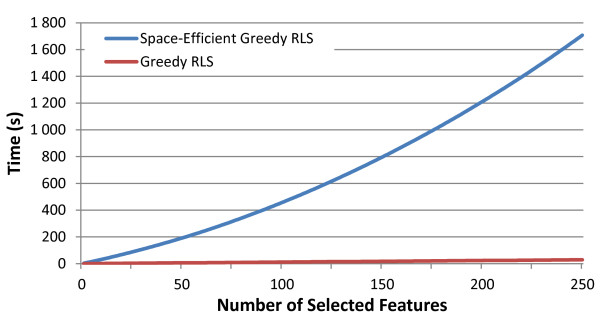
Comparison of the greedy RLS implementations. Plot showing the timing comparison (in seconds) for the two variations of greedy RLS. Note the linearity in the greedy RLS curve compared to the quadratic nature of the space-efficient version with respect to the number of selected features. The run was based on randomly sampled datasets with 1,000 training examples and 10,000 features.