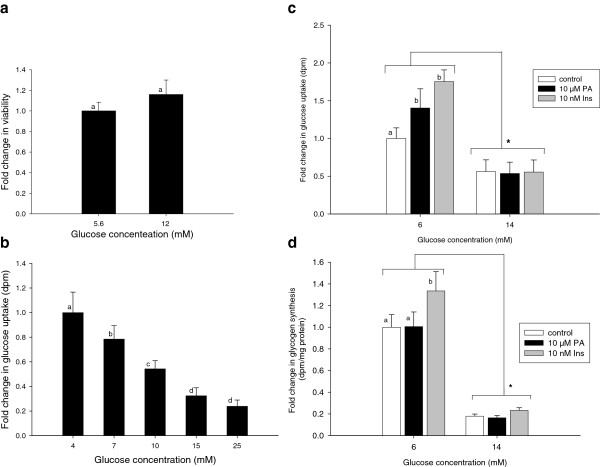
Figure 4.
Exposure of myotubes to extracellular glucose. Differentiated myotubes treated with two different concentrations of glucose for 24 h were subjected to viability assay (a). Glucose uptake was also performed on myotubes exposed to various glucose concentrations (b). Myotubes exposed to 6 mM glucose (controls) or 14 mM glucose for 24 h in the absence (open bars) or presence of PA (black bars) or insulin (grey bars) were subjected either to (c) glucose uptake or (d) glycogen synthesis measurements. PA was administered for 24 h while insulin was given during the last 1 h of incubation for glucose uptake measurements and 2 h for glycogen synthesis. Data are expressed as LSmean values of four replicate wells, carried out in three separate experiments with cells isolated from a different pig each time. LSmeans with different letters (a and b) denote significantly different responses related to PA or insulin treatments, while statistical difference in LSmeans between controls and myotubes given 14 mM glucose is denoted with *; (P < 0.05).

