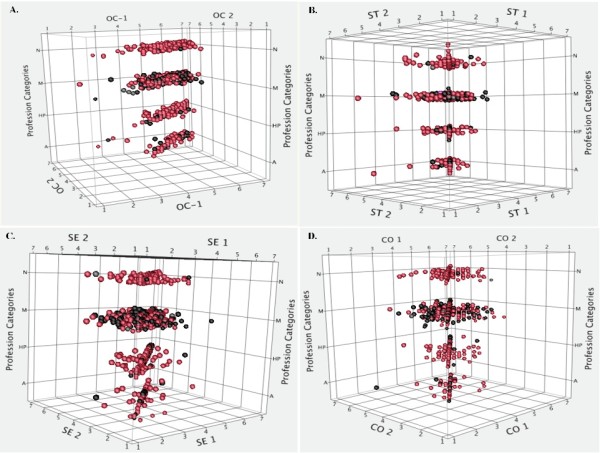
Figure 6.

Four high order values (Schwartz's theory) before and after CME intervention. Each row includes N = Nurses, M = Medical Doctors, HP = Others Healthcare Professionals. A = Administrative personnel. Spheres in red are females. 1 = Before and 2 = After educational intervention. A: Scatter plot in 3D. Openness to Change. Spheres representing post-CME intervention appear compacted. B: Scatter plot in 3D. Self-transcendence. Spheres representing post-CME intervention appear compacted. C: Scatter plot in 3D. Self-Enhancement. D: Scatter plot in 3D. Conservation.
