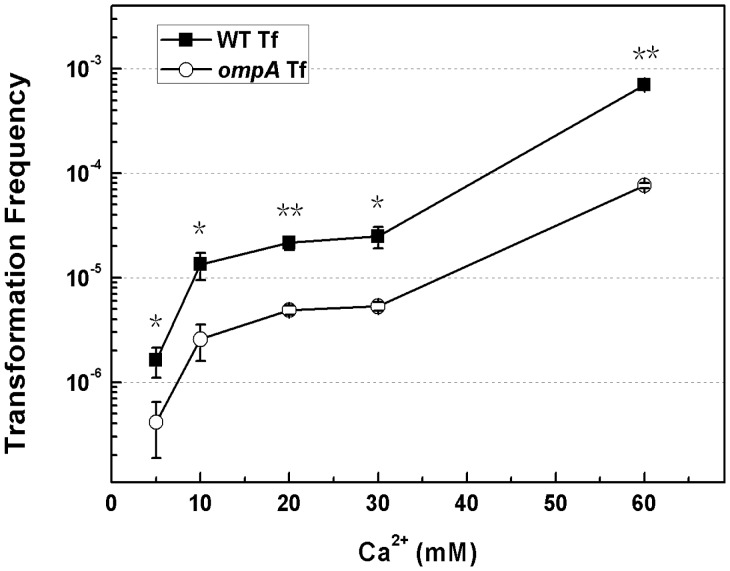
Figure 3. Effect of ompA inactivation on chemical transformation with a series of concentrations of Ca2+.
Competent E. coli cells were prepared with CaCl2 solution at serial concentrations (5, 10, 20, 30 and 60 mM). Transformation frequencies of BW25113 (solid square symbols) and the ompA mutant JW0940 (BW25113::ompA::kan, open circle symbols) were shown. Each point denotes an average of 2 samples. Error bars denote standard deviation. *P value ≦ 0.05; **P value ≦ 0.01.

