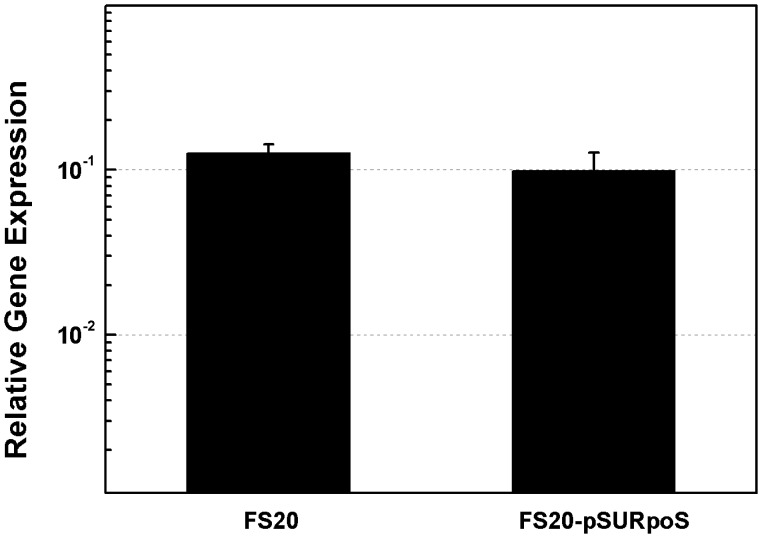
Figure 5. Quantification of ompA transcripts in the rpoS– and the rpoS+ strains.
The transcription of ompA was quantified in strains FS20-pSU (rpoS–) and FS20-pSURpoS (rpoS+) with Real-time PCR using 16s rRNA as the reference. Each column denotes an average of 4 samples. Error bars denote standard deviation.

