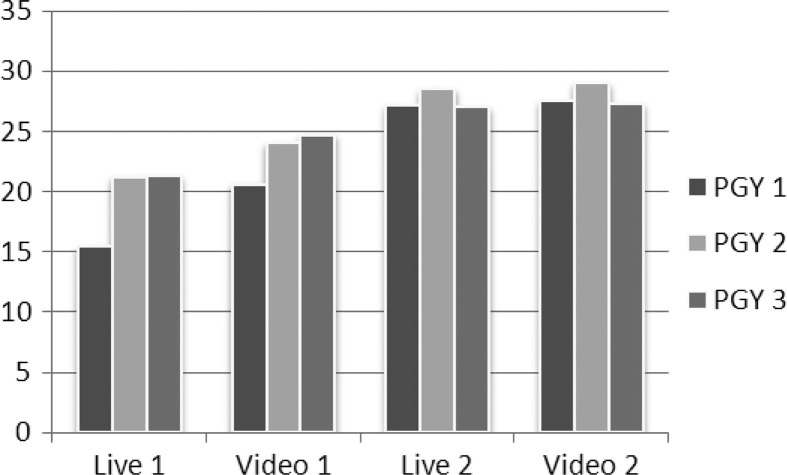
Fig. 2.
Difference in observed performance by post-graduate year of training for live and video-based assessments. The x-axis represents performance by year of training for live and video-based assessments. The y-axis represents the mean total score for observed critical performance indicators for scenarios 1 and 2.

