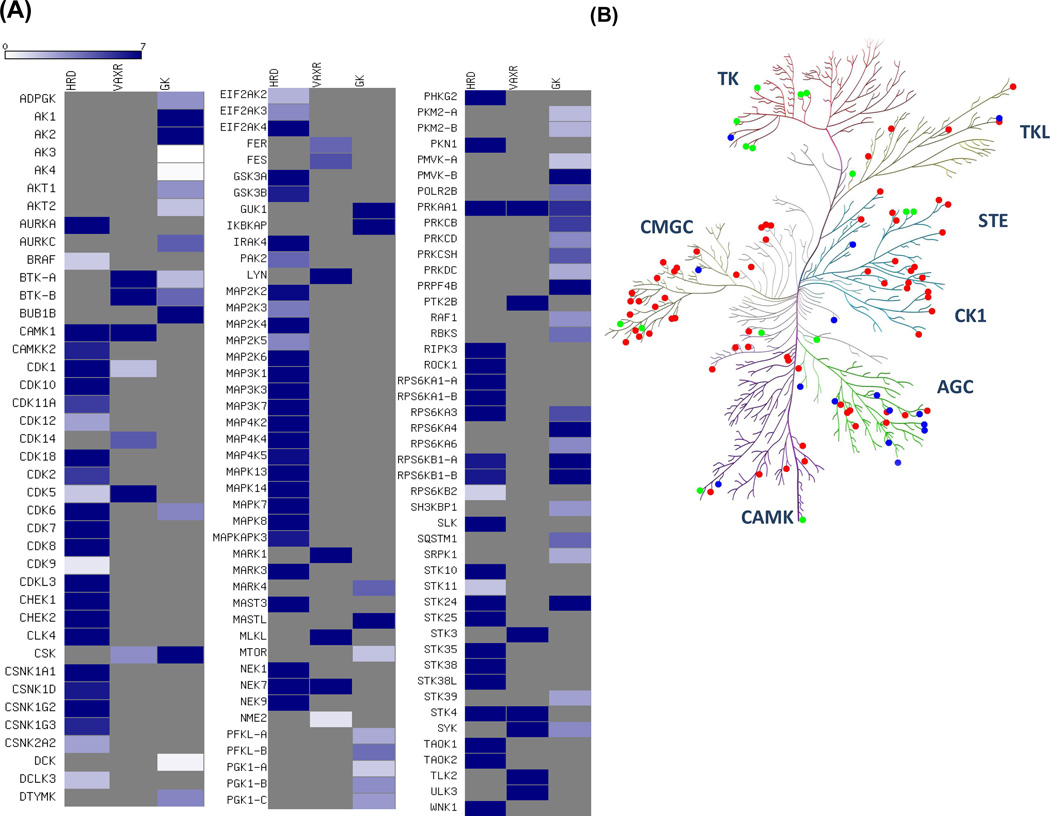
Figure 6.
(A) A heatmap displaying the relative selectivity of ATP/GTP towards each possible binding motif of kinases. Dark blue and white indicate significant ATP-binding preference with high RATP/GTP ratio and significant GTP-binding preference with small RATP/GTP ratio, respectively (See scale bar above the heatmap). (B) Protein kinases were mapped to the human kinome dendrogram with color annotation to specify the motif with the highest RATP/GTP ratio. Red, green and blue represent kinases with HRDxKxxN, VAxK, and GxxxxGK motifs, respectively.

