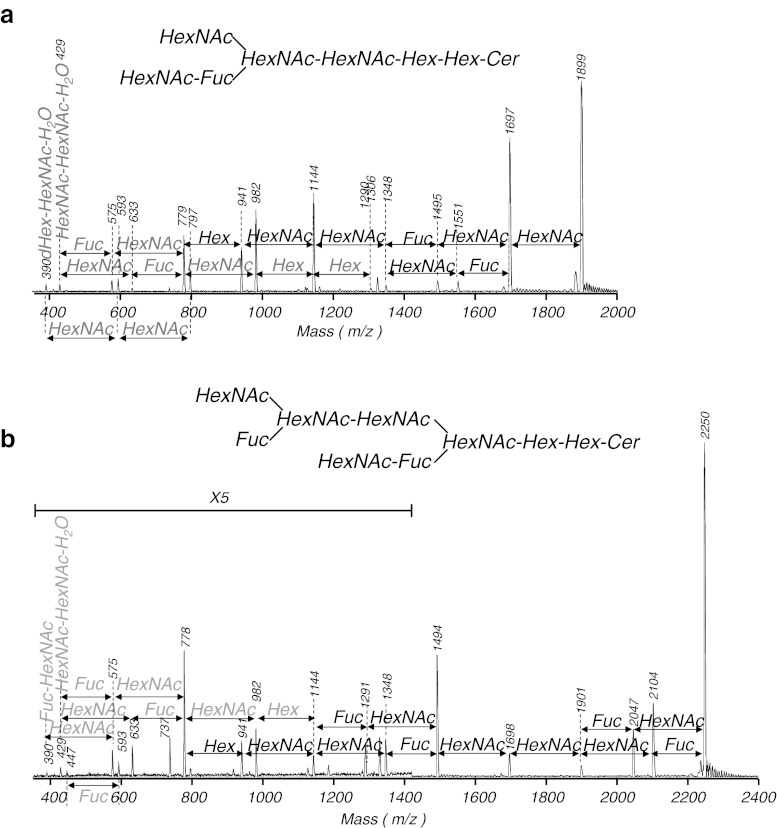
Fig. 4.
Representative positive-ion PSD spectra in MALDI-TOF MS of the separated GSLs. a CHpS1; b CNS. Black arrows indicate mass differences between fragments with a ceramide molecular group. Gray arrows indicate mass differences between fragments without a ceramide molecular group. All fragments were detected as sodium adducts. The spectrum of b was expanded by a factor of 5 in the low-molecular-weight region

