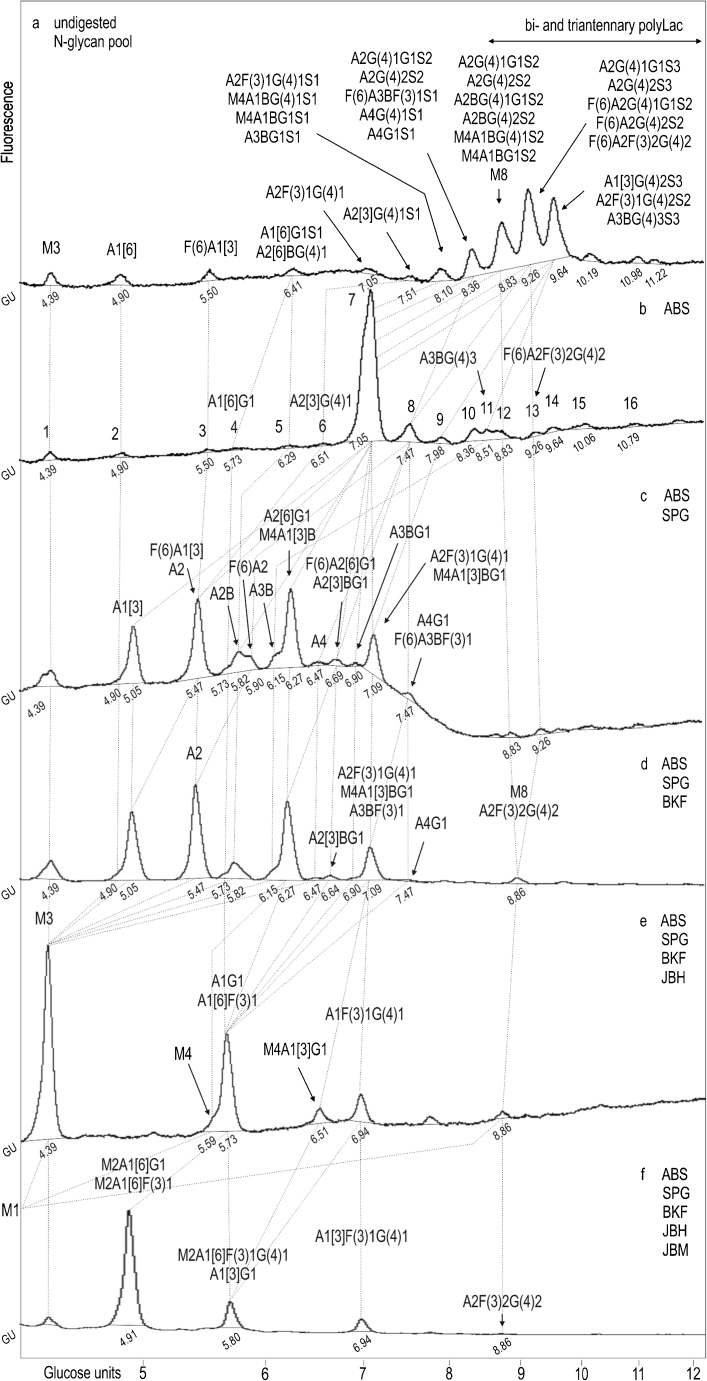
Fig. 1.
HPLC profiles of the N-glycan pool of L1CAM from primary WM793 cell line simultaneously digested with a series of enzyme arrays. HPLC analysis of the total glycan pool a and the products resulting from digestion of five aliquots of the total glycan pool with a series of enzyme arrays b–f. The enzymes used were as follows: ABS, Arthrobacter ureafaciens sialidase (removes all sialic acids); SPG, Streptococcus pneumoniae β-galactosidase (removes only β1-4-linked galactose); BKF, bovine kidney α-fucosidase (removes α1-2,6,3,4-linked fucose); JBH, jack bean α-N-acetylhexosaminidase (removes GlcNAc); JBM, jack bean α-mannosidase (removes α1-2,6,3-linked mannose). The glucose unit (GU) value of each peak was calculated by comparison with the dextran hydrolysate ladder shown at the bottom of the figure. Structures were assigned from the glucose unit values, the known incremental values for monosaccharide residues and the known specificity of the exoglycosidase enzymes. The structure abbreviations used were as follows: all N-glycans have two core GlcNAcs, Aa[3/6] indicates the number “a” of antennae on the trimannosyl core linked to the 3/6-mannose arm; G(4)b and Gc indicate the number “b” and “c” of terminal galactose residues β1-4- and β1-3-linked to antenna GlcNAc respectively; F(6) and F(3)d indicate a core fucose α1-6-linked to the core GlcNAc and “d” fucose residues α1-3-linked to antenna GlcNAc respectively; B, represents bisecting GlcNAc β1-4-linked to core mannose; Me represents the number “e” of mannose residues; Sf represents the number “f” of sialic acids linked to the galactose or N-acetylglucosamine in antennae. Dotted lines indicate the shifts of the glycans digested by the subsequent enzyme array. M1 structure with a GU value of 2.70 is outside the chromatogram (panel f)

